Key points:
-
Buyers will have to sustain Bitcoin above $69,000 to gain the upper hand in the short term.
-
Select major altcoins may break above their near-term resistance, signaling buying at lower levels.
Bitcoin (BTC) is facing resistance at $69,000, but the bulls continue to exert pressure. A minor positive in favor of the bulls is that the US spot BTC exchange-traded funds have recorded $186.9 million in inflows this week, according to Farside Investors data.
Is this a good level to buy BTC, or could it fall further? That’s a question troubling investors. Alphractal founder Joao Wedson said in a post on X that BTC’s previous market cycles suggest a historical bottom may form “in late September or early October 2026.”
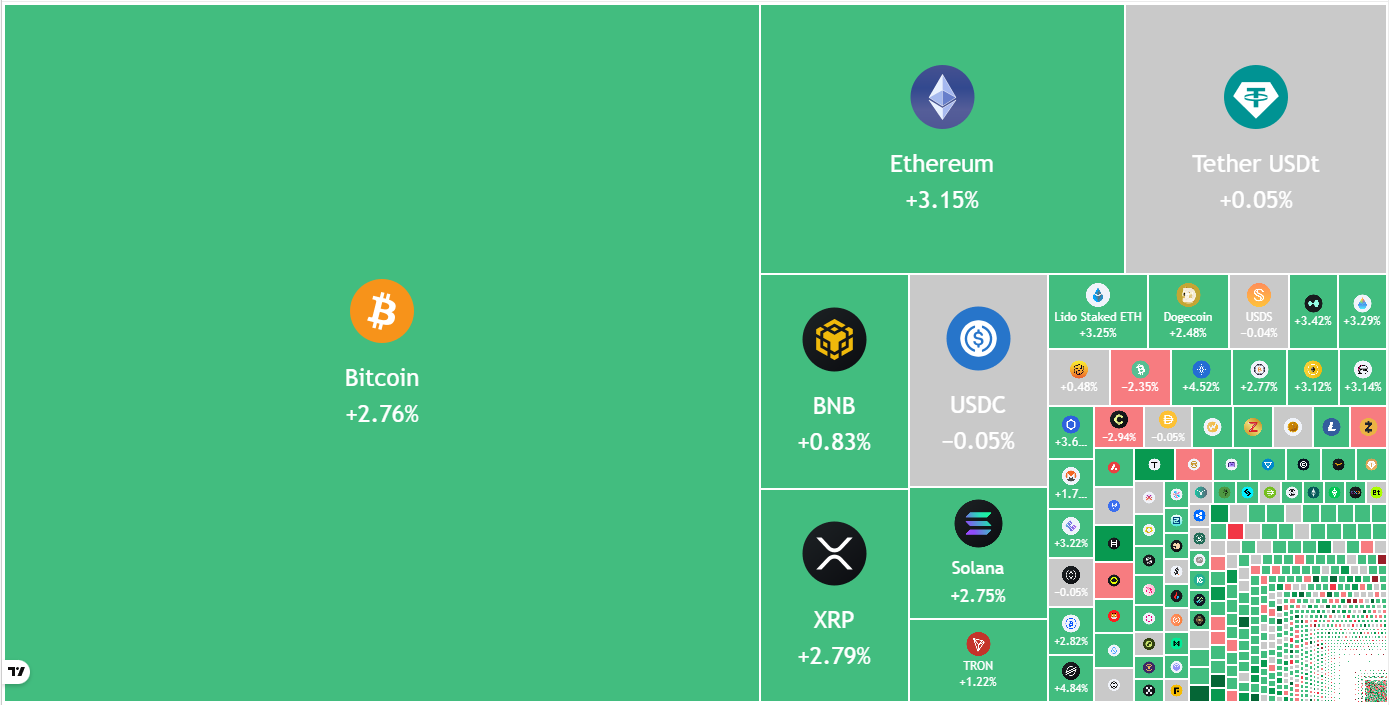
_Crypto market data daily view. Source: _TradingView
Veteran trader Peter Brandt also believes that BTC could bottom in September or October. Brandt told Cointelegraph that a complete recovery to a new all-time high may happen only by the second quarter of 2027 but he added that it “is all guesswork.”
Could BTC and select major altcoins rise above their overhead resistance levels? Let’s analyze the charts of the top 10 cryptocurrencies to find out.
Bitcoin price prediction
Buyers are attempting to sustain BTC above the moving averages, indicating solid buying at lower levels.
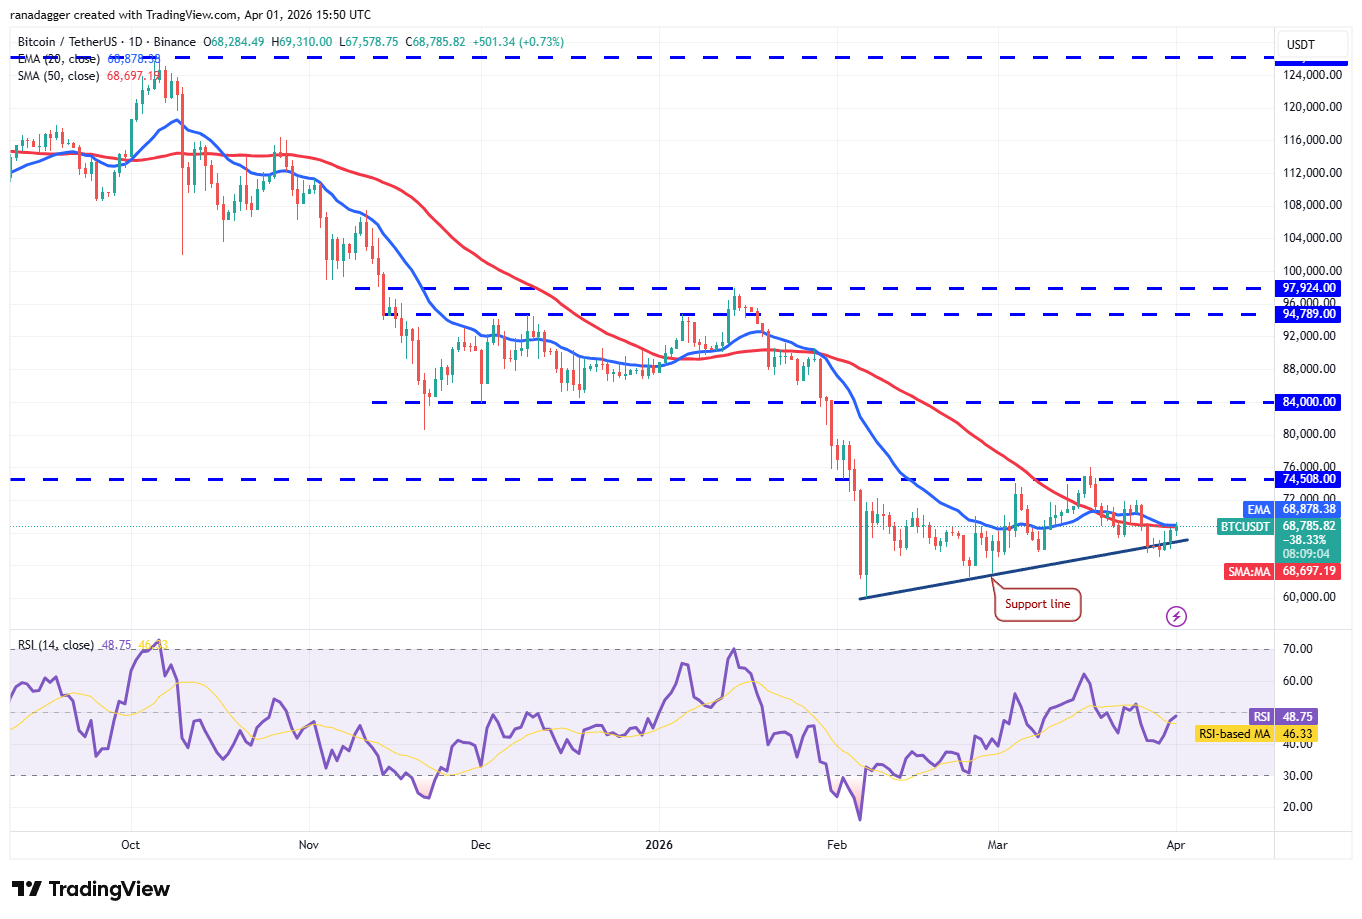
_BTC/USDT daily chart. Source: Cointelegraph/_TradingView
If they succeed, the BTC/USDT pair may remain inside the bullish ascending triangle pattern. Buyers will have to thrust the BTC price above the $76,000 level to seize control. The pair may then surge to the $84,000 level.
This positive view will be negated in the near term if the BTC price turns down and breaks below the $65,000 level. That will invalidate the positive setup, resulting in long liquidation. The pair may then tumble to the $62,500 to $60,000 support zone.
Ether price prediction
Ether (ETH) closed above the 20-day exponential moving average ($2,085) on Tuesday, and the bulls are attempting to push the price to the $2,200 overhead resistance.
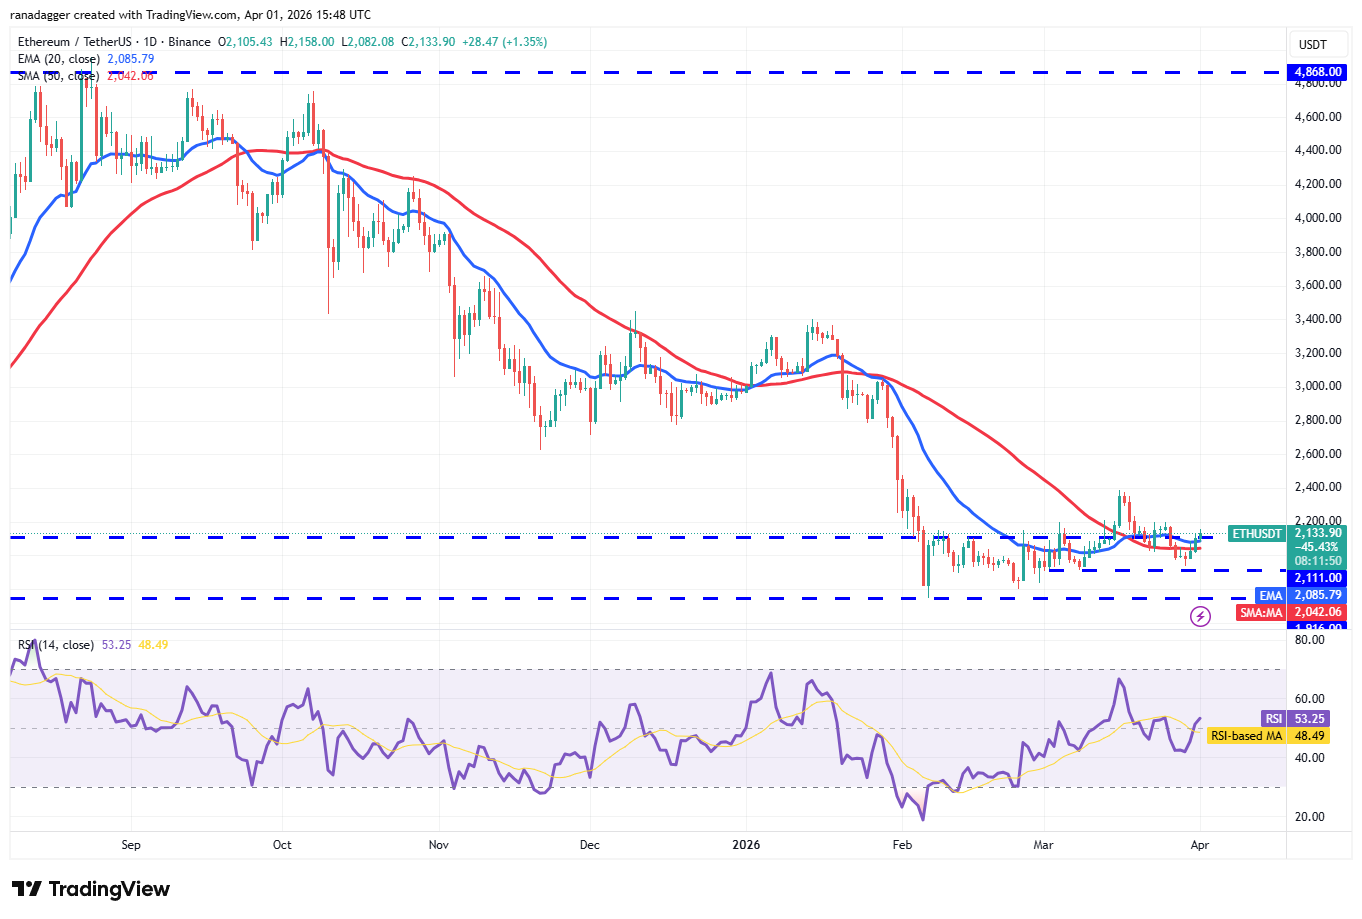
ETH/USDT daily chart. Source: Cointelegraph/TradingView
If buyers overcome the barrier at $2,200, the ETH/USDT pair is expected to pick up momentum and rise to $2,400. Sellers will attempt to vigorously defend the $2,400 level, as a close above it opens the gates for a rally to the $3,050 level.
Time is running out for the bears. They will have to quickly pull the price below the $1,916 level to stay in the game. If they do that, the ETH price may plummet to the critical $1,750 support.
BNB price prediction
Buyers are attempting to push BNB (BNB) above the moving averages, but the bears have held their ground.
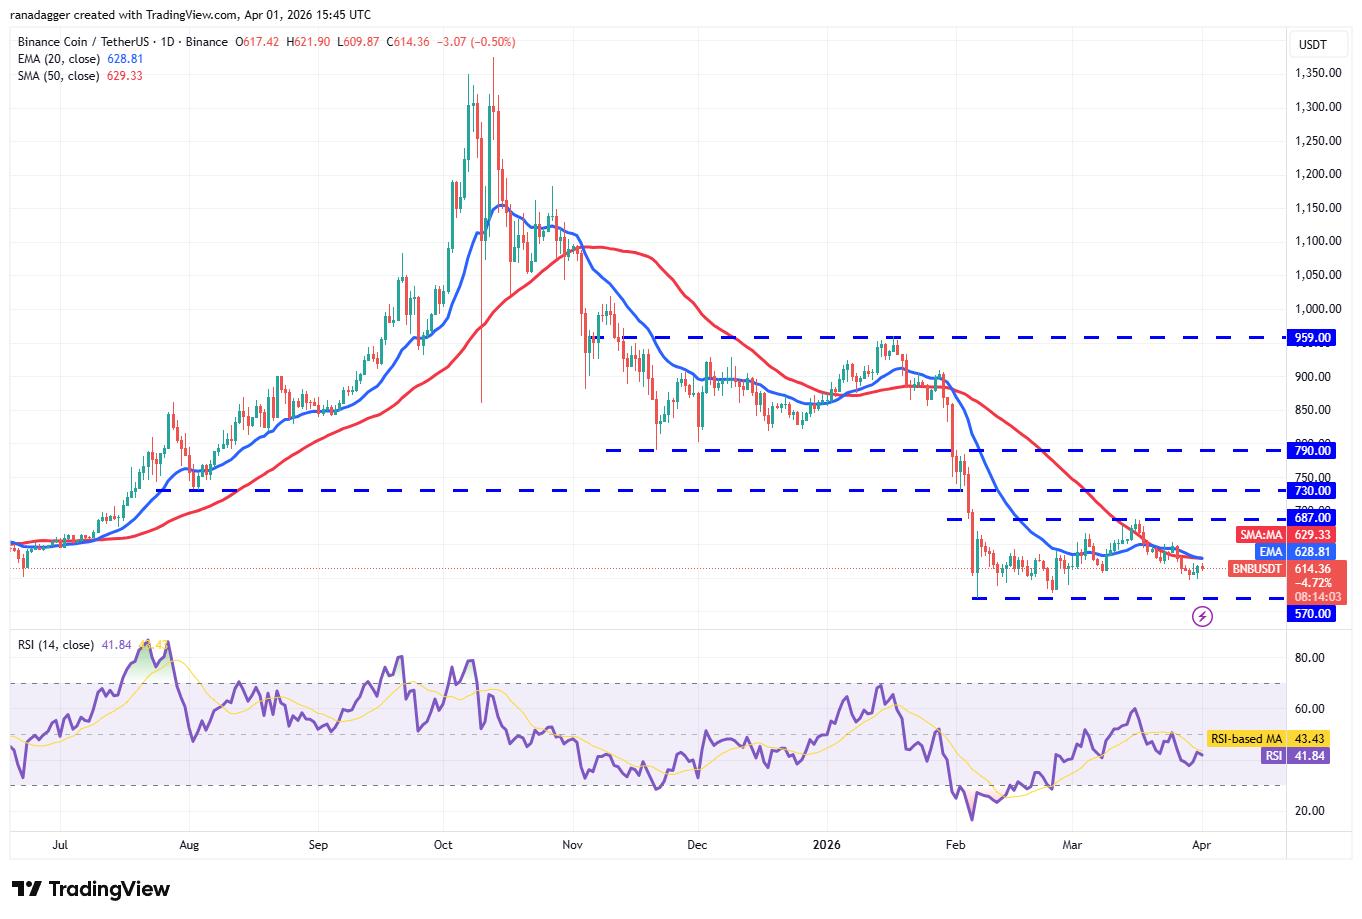
BNB/USDT daily chart. Source: Cointelegraph/TradingView
Sellers will strive to pull the BNB price below the immediate support at $596. If they manage to do that, the BNB/USDT pair may slip to the vital support at $570. Buyers are expected to defend the $570 level with all their might, as a close below it signals the resumption of the downtrend. The next stop on the downside may be $500.
Alternatively, a close above the moving averages may push the price to the stiff overhead resistance of $687. A close above the $687 level will be the first sign of strength. The pair may then march to $730 and thereafter to $790.
XRP price prediction
XRP (XRP) is trying to form a base near the $1.29 level, but the bulls are struggling to push and maintain the price above the moving averages.
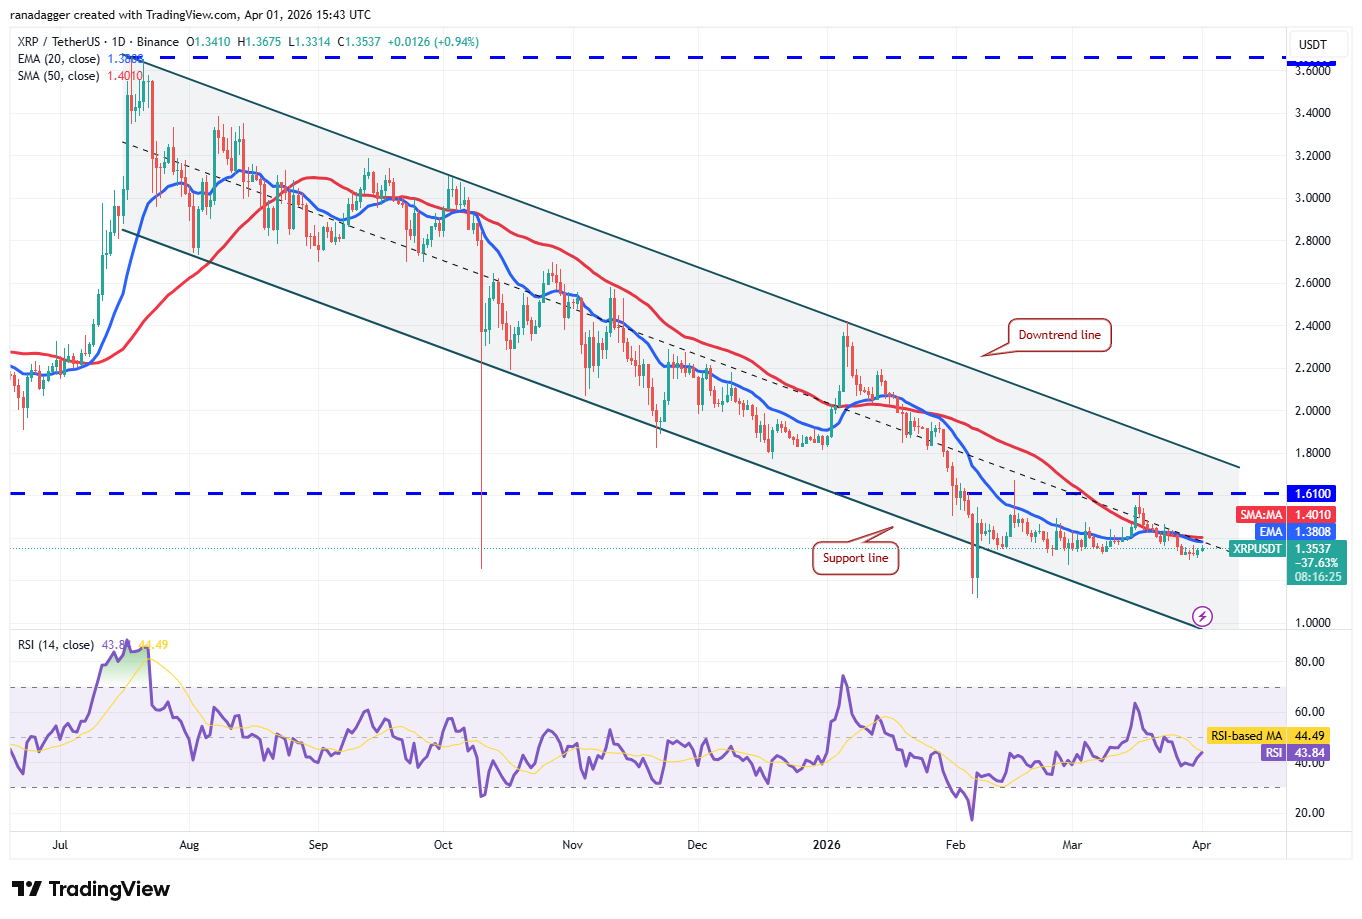
XRP/USDT daily chart. Source: Cointelegraph/TradingView
That suggests the bears have kept up the pressure. If the XRP price turns down and breaks below the $1.27 level, it signals that bears have overpowered the bulls. The XRP/USDT pair may then decline to the $1.11 level.
On the contrary, a break above the moving averages indicates that the bulls are back in the game. The pair may rise to the breakdown level of $1.61 and then to the downtrend line. A close above the downtrend line signals a potential trend change.
Solana price prediction
Solana (SOL) is attempting to form a floor at the $76 level, but the relief rally is facing stiff resistance at the moving averages.
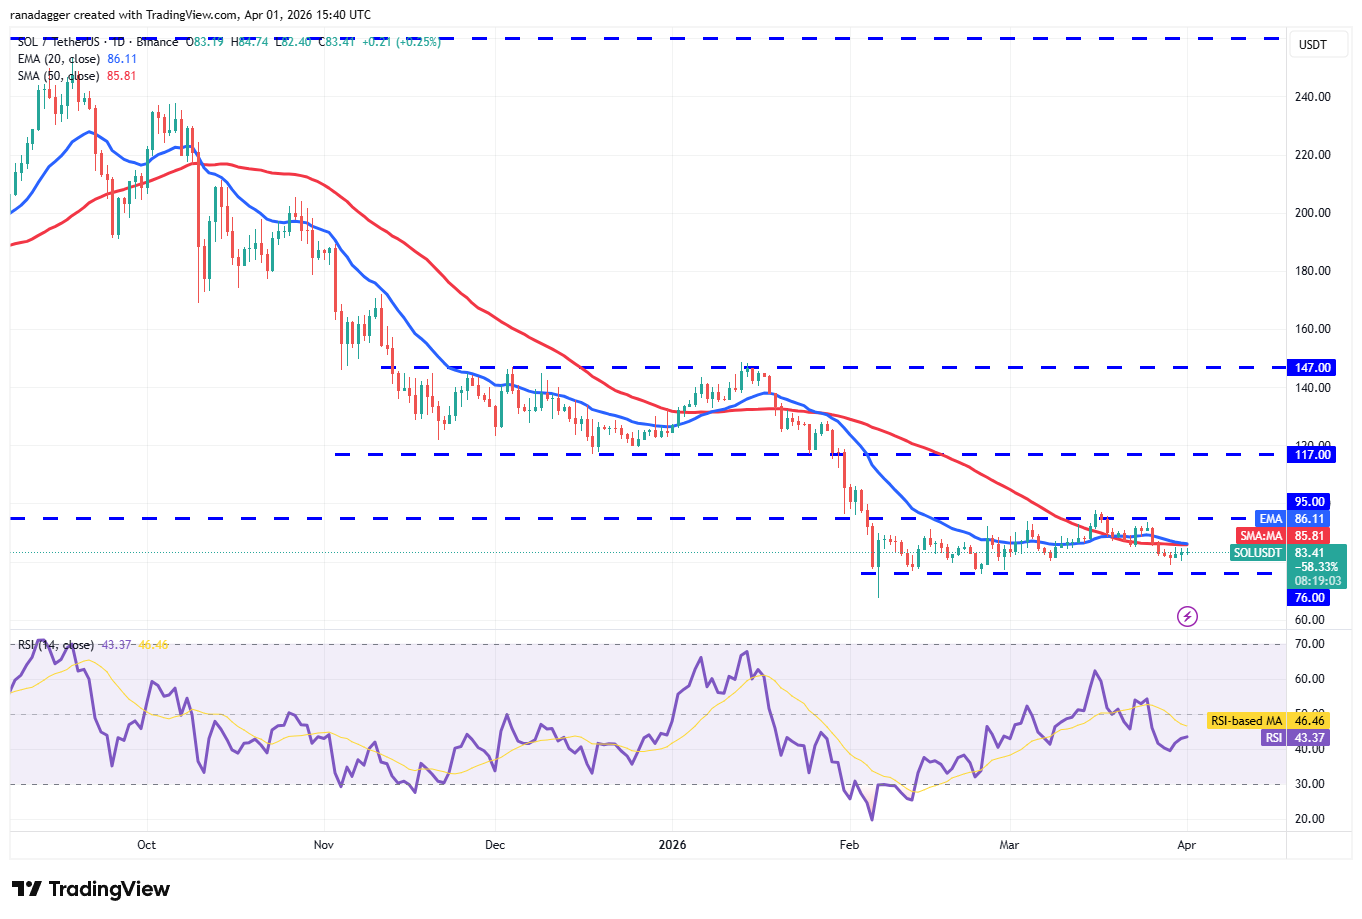
SOL/USDT daily chart. Source: Cointelegraph/TradingView
The flattish moving averages and the relative strength index just below the midpoint do not give a clear advantage either to the bulls or the bears. If the price breaks above the moving averages, the bulls will endeavor to push the SOL/USDT pair above the $95 resistance. If they succeed, the rally may extend to the $117 level.
Contrarily, if the SOL price turns down sharply from the $95 level, it suggests that the range-bound action may continue for a while. Sellers will be back in command on a close below the $76 level.
Dogecoin price prediction
Dogecoin (DOGE) remains stuck between the moving averages and the critical $0.09 support, but the tight range trading is unlikely to continue for long.
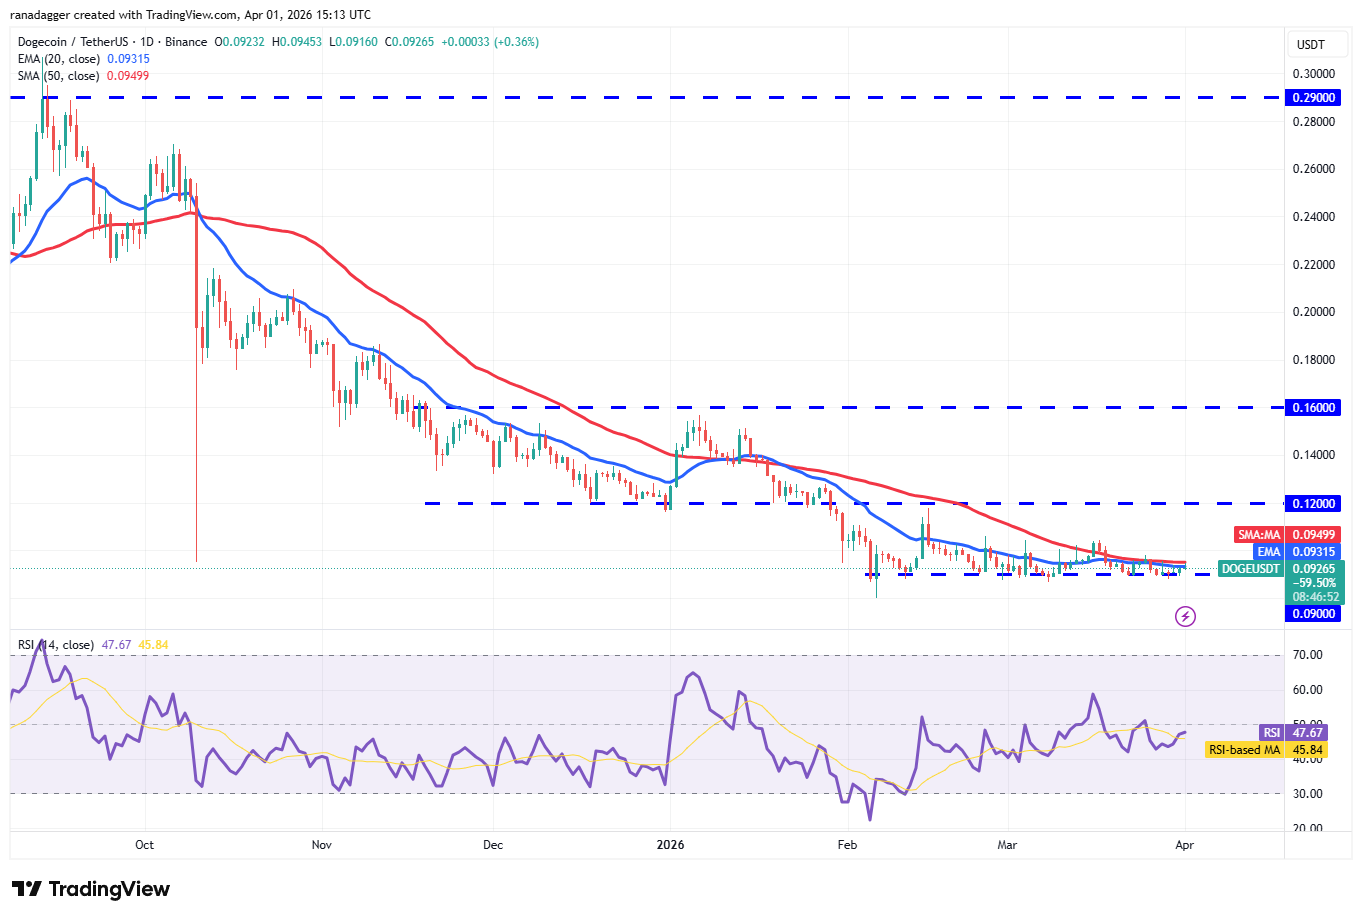
DOGE/USDT daily chart. Source: Cointelegraph/TradingView
If buyers thrust the DOGE price above the moving averages, the relief rally may reach $0.10 and then the $0.12 resistance. Sellers are expected to fiercely defend the $0.12 level. If the price turns down from the overhead resistance, the DOGE/USDT pair may consolidate between $0.09 and $0.12 for a few more days.
Sellers will seize control on a close below the $0.09 level. The pair may then sink to the Feb. 6 low of $0.08 and eventually to the $0.06 level.
Hyperliquid price prediction
Hyperliquid (HYPE) fell below the breakout level of $36.77 on Tuesday, but the bears are struggling to sustain the lower levels.
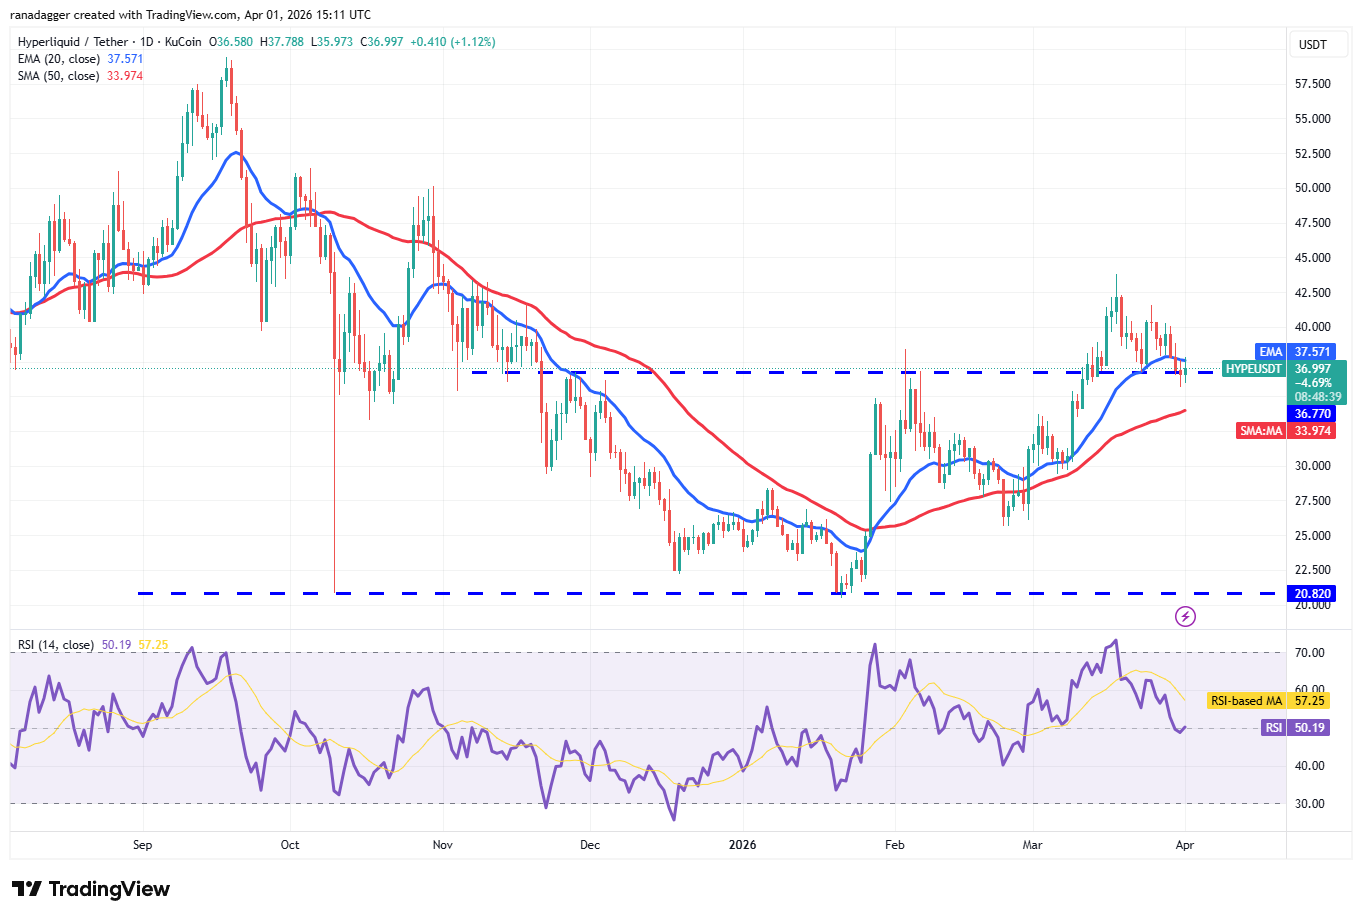
HYPE/USDT daily chart. Source: Cointelegraph/TradingView
The bulls are attempting to make a comeback by swiftly pushing the HYPE price back above the 20-day EMA ($37.57). If they can pull it off, the HYPE/USDT pair may rise to $41.59 and subsequently to the $43.76 level. Sellers will attempt to halt the up move at $43.76, but if the bulls prevail, the pair may climb to $50.
This positive view will be invalidated in the near term if the price turns down and breaks below the 50-day simple moving average ($33.97). That suggests the market has rejected the break above the $36.77 level.
**Related: **__Strategy set to resume buying Bitcoin via STRC: Will BTC price hit $80K?
Cardano price prediction
Cardano (ADA) is facing resistance at the $0.25 level, but a positive sign is that the bulls have not ceded ground to the bears.
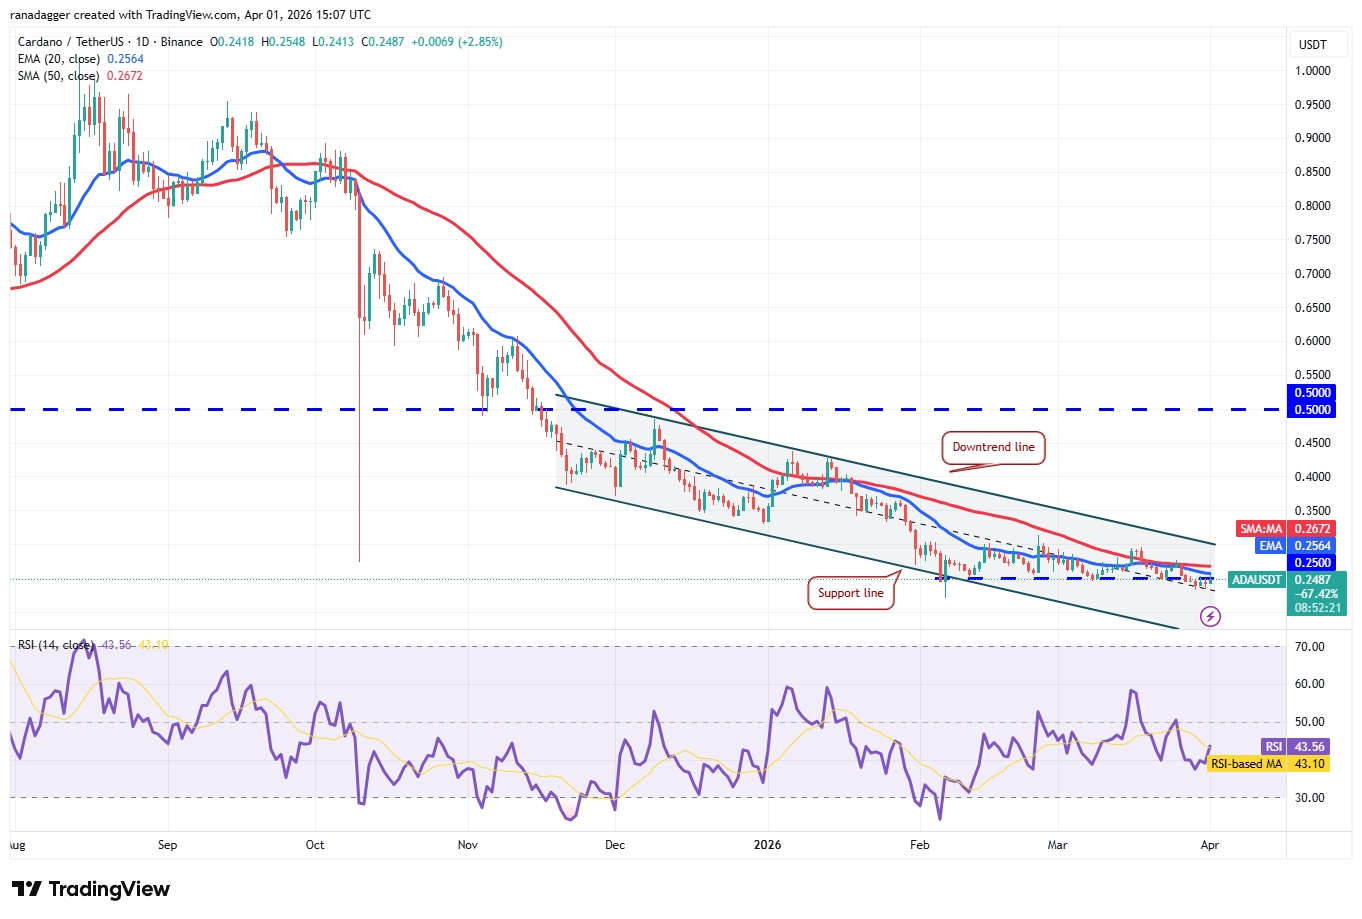
ADA/USDT daily chart. Source: Cointelegraph/TradingView
Buyers will attempt to overcome the barrier at the moving averages. If they do that, the ADA/USDT pair may reach the downtrend line, which is a crucial resistance to watch out for. A close above the downtrend line signals a potential short-term trend change.
Sellers are likely to have other plans. They will attempt to defend the moving averages and pull the ADA price below the $0.23 level. If that happens, the pair may slide to the Feb. 6 low of $0.22.
Bitcoin Cash price prediction
Bitcoin Cash (BCH) has been trading between the 50-day SMA ($485) and the $443 support for the past few days.
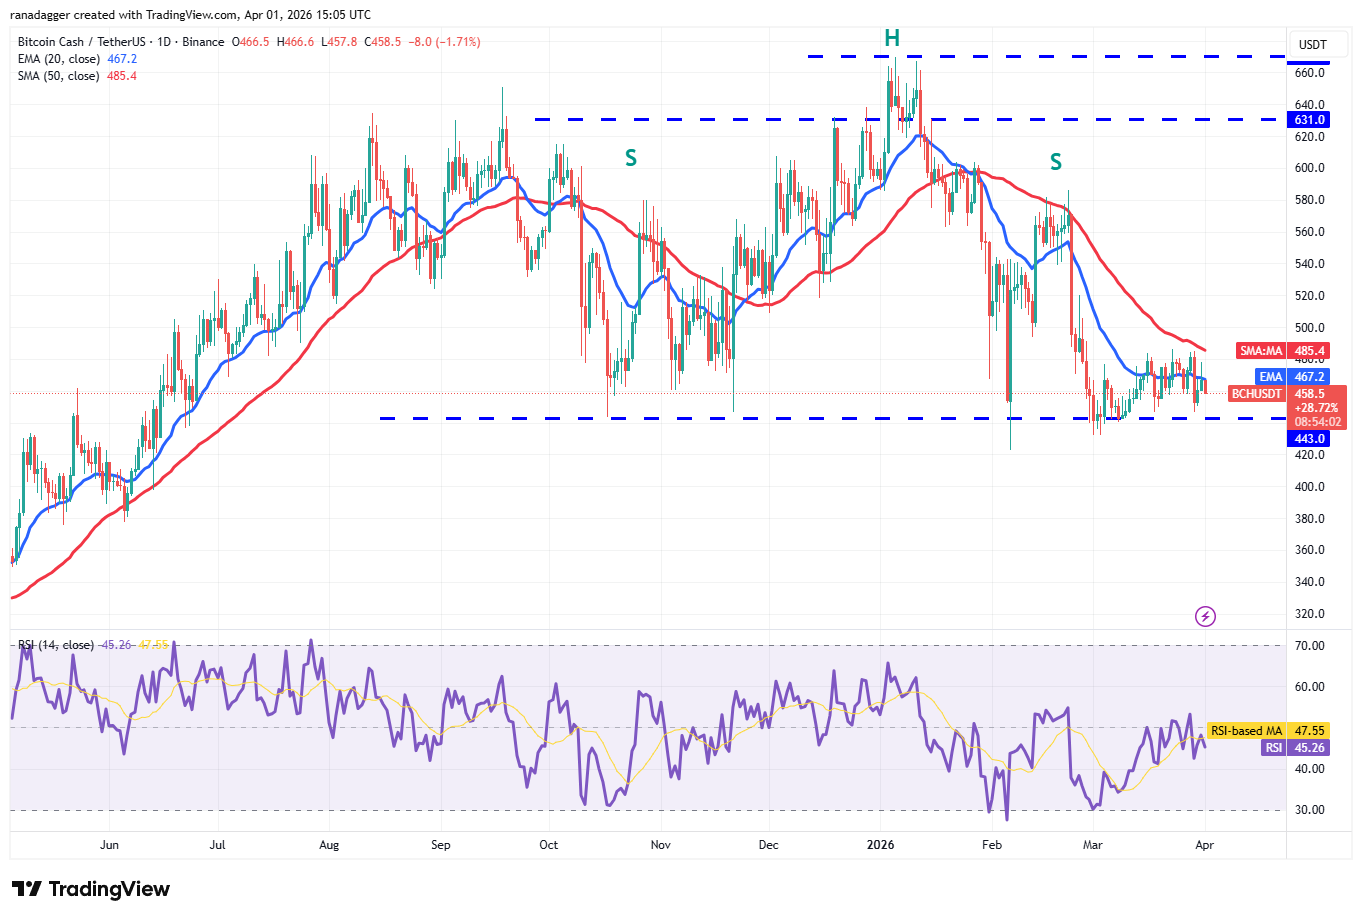
BCH/USDT daily chart. Source: Cointelegraph/TradingView
The failure of the bulls to clear the 50-day SMA suggests that the bears are active at higher levels. Sellers will attempt to strengthen their position by pulling the BCH price below the $443 level. If they manage to do that, the BCH/USDT pair will complete a bearish head-and-shoulders pattern. That opens the doors for a drop to the $375 level.
Instead, if buyers drive the price above the 50-day SMA, it signals demand at lower levels. The pair may then ascend to the $520 to $540 zone.
Chainlink price prediction
Chainlink (LINK) is facing resistance at the moving averages, but a positive sign is that the bulls have kept up the pressure.
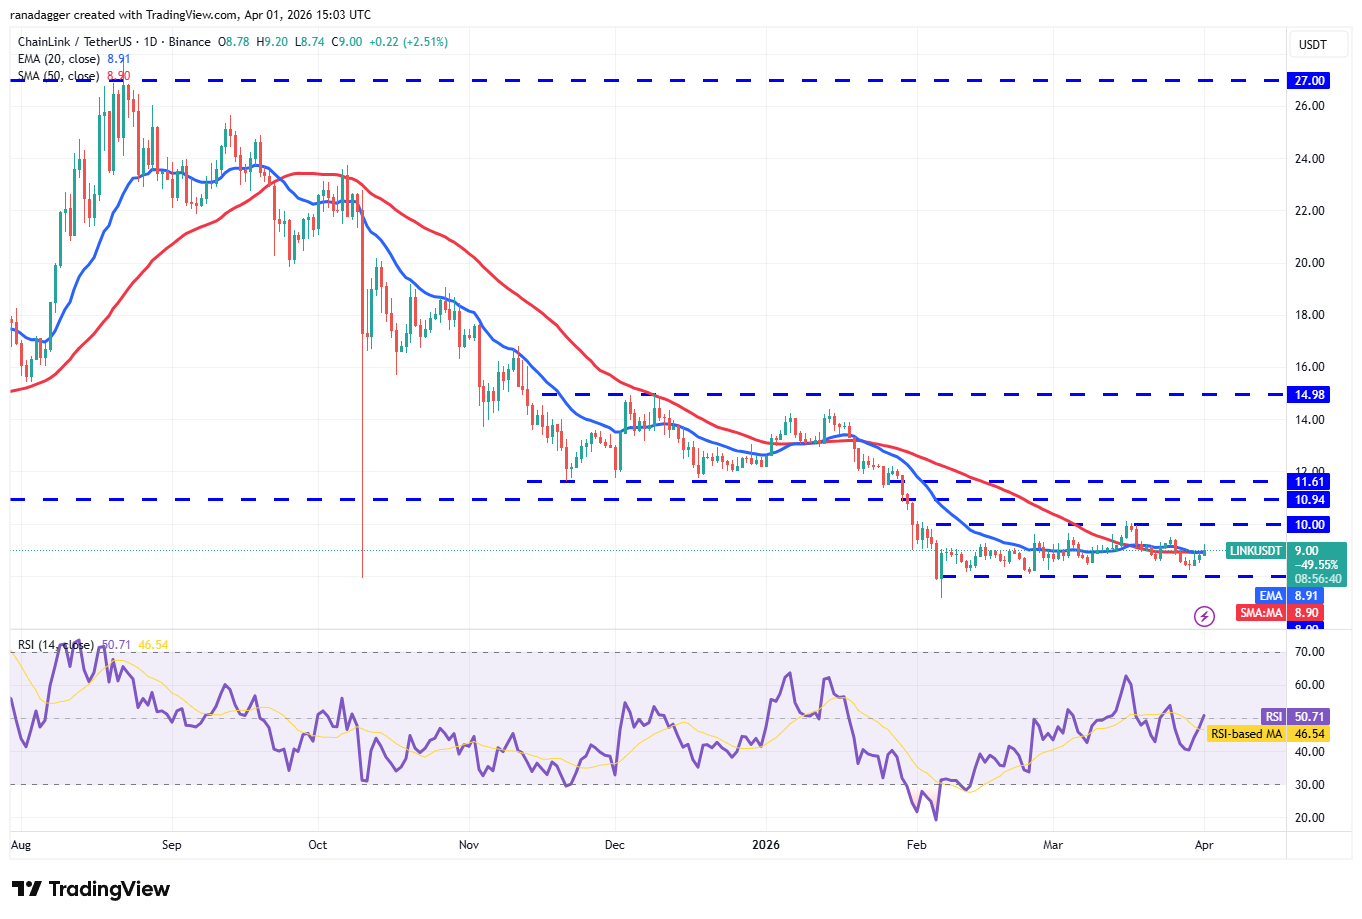
LINK/USDT daily chart. Source: Cointelegraph/TradingView
That improves the prospects of a close above the moving averages. If that happens, the LINK price may rally toward the $10 level. Sellers will attempt to defend the $10 level and keep the LINK/USDT pair range-bound for some more time.
The next trending move is expected to begin on a close above $10 or below $8. If buyers pierce the $10 level, the pair may rise to $10.94 and later to the $11.61 level. Alternatively, a drop below the $8 support may sink the price to $7.15 and then to $6.
This article does not contain investment advice or recommendations. Every investment and trading move involves risk, and readers should conduct their own research when making a decision. While we strive to provide accurate and timely information, Cointelegraph does not guarantee the accuracy, completeness, or reliability of any information in this article. This article may contain forward-looking statements that are subject to risks and uncertainties. Cointelegraph will not be liable for any loss or damage arising from your reliance on this information.
- #Bitcoin
- #Dogecoin
- #Cryptocurrencies
- #Bitcoin Price
- #XRP
- #Markets
- #United States
- #Cryptocurrency Exchange
- #Bitcoin Cash
- #Cardano
- #Price Analysis
- #Chainlink
- #Market Analysis
- #Solana
- #Bitcoin ETF
- #ETF
- #BNB
