Bitcoin (BTC) is trading within a bear flag pattern that projects a breakdown toward the sub-$50,000 area, or roughly 30% below current levels. However, Michael Saylor’s Strategy could spoil the bears’ plans.
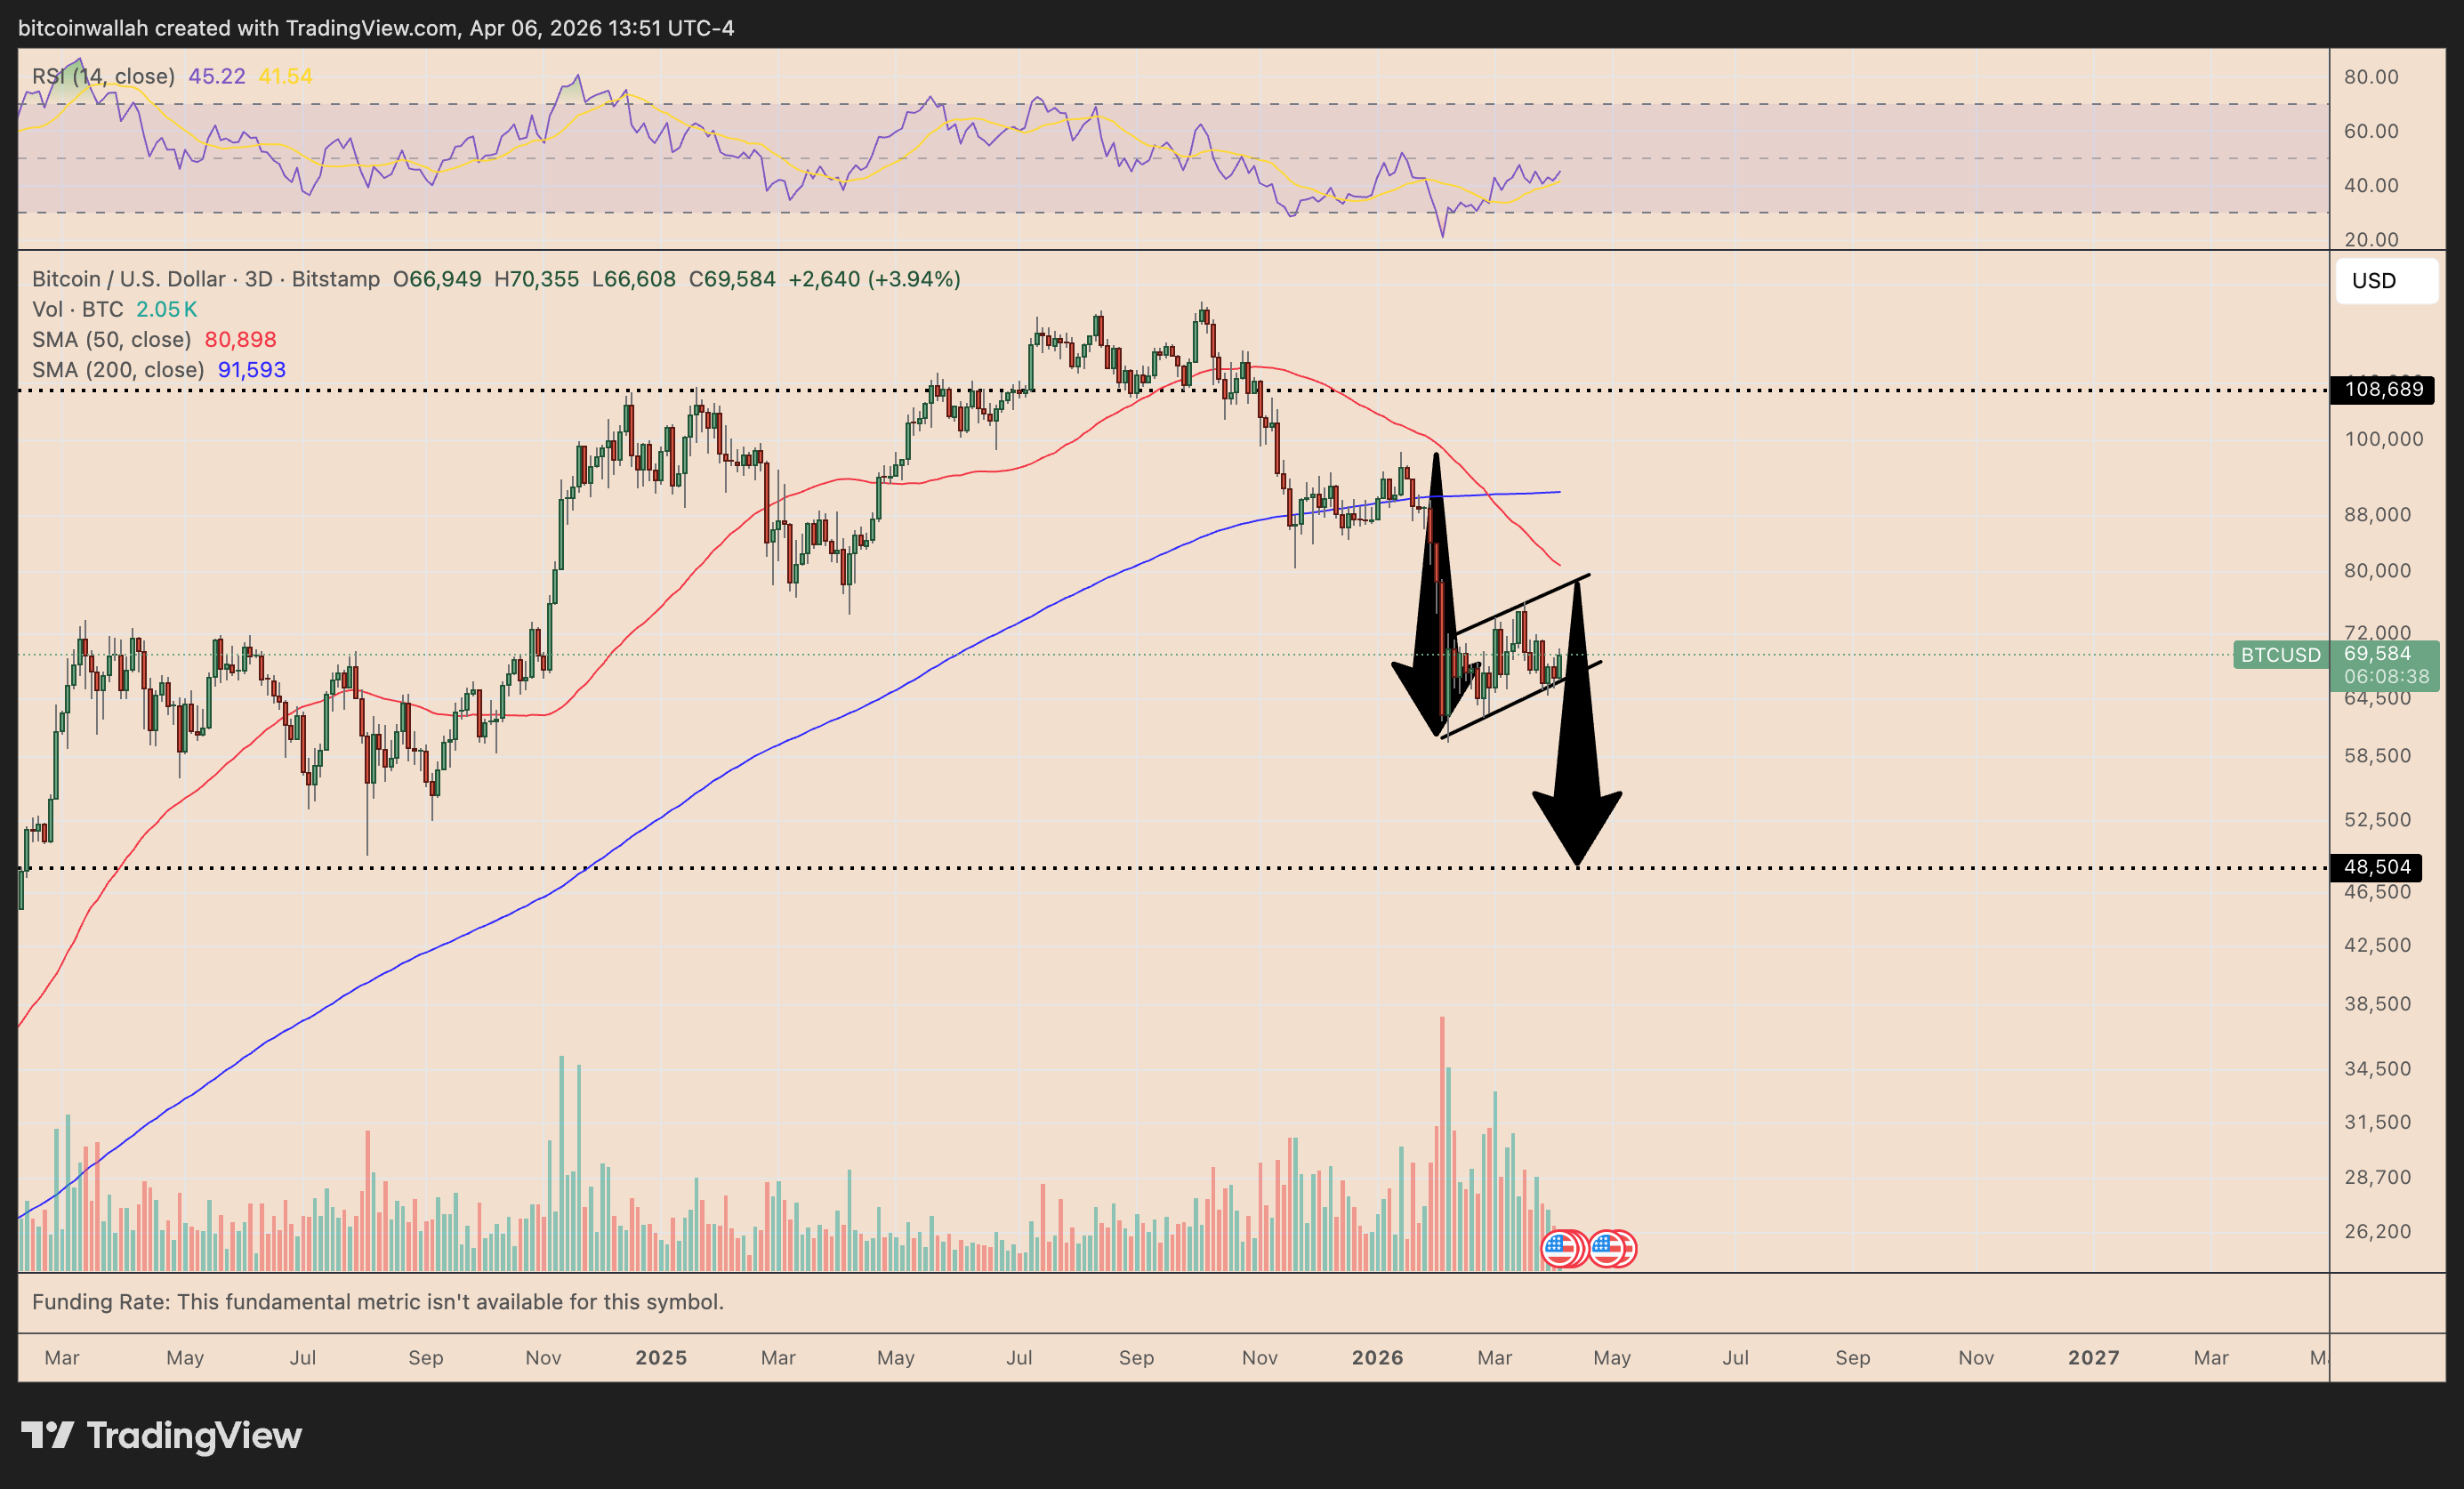
_BTC/USD three-day price chart. Source: _TradingView
Key takeaways:
-
Bitcoin has avoided a bear flag breakdown for weeks as Strategy keeps buying BTC.
-
The setup now resembles Bitcoin’s 2018 bottom, when a bearish pattern failed and triggered a reversal.
Can Strategy’s BTC buying offset weak technicals?
Normally, a bear flag remains a bearish continuation pattern because there is not enough demand to overcome the broader downtrend.
In Bitcoin’s case, however, Strategy has been taking supply off the market faster than miners can replace it.
Since March 2, Strategy’s Bitcoin holdings have risen by 46,233 BTC, while miners have produced only about 16,200 BTC over the same period, meaning it has absorbed nearly thrice the new supply.
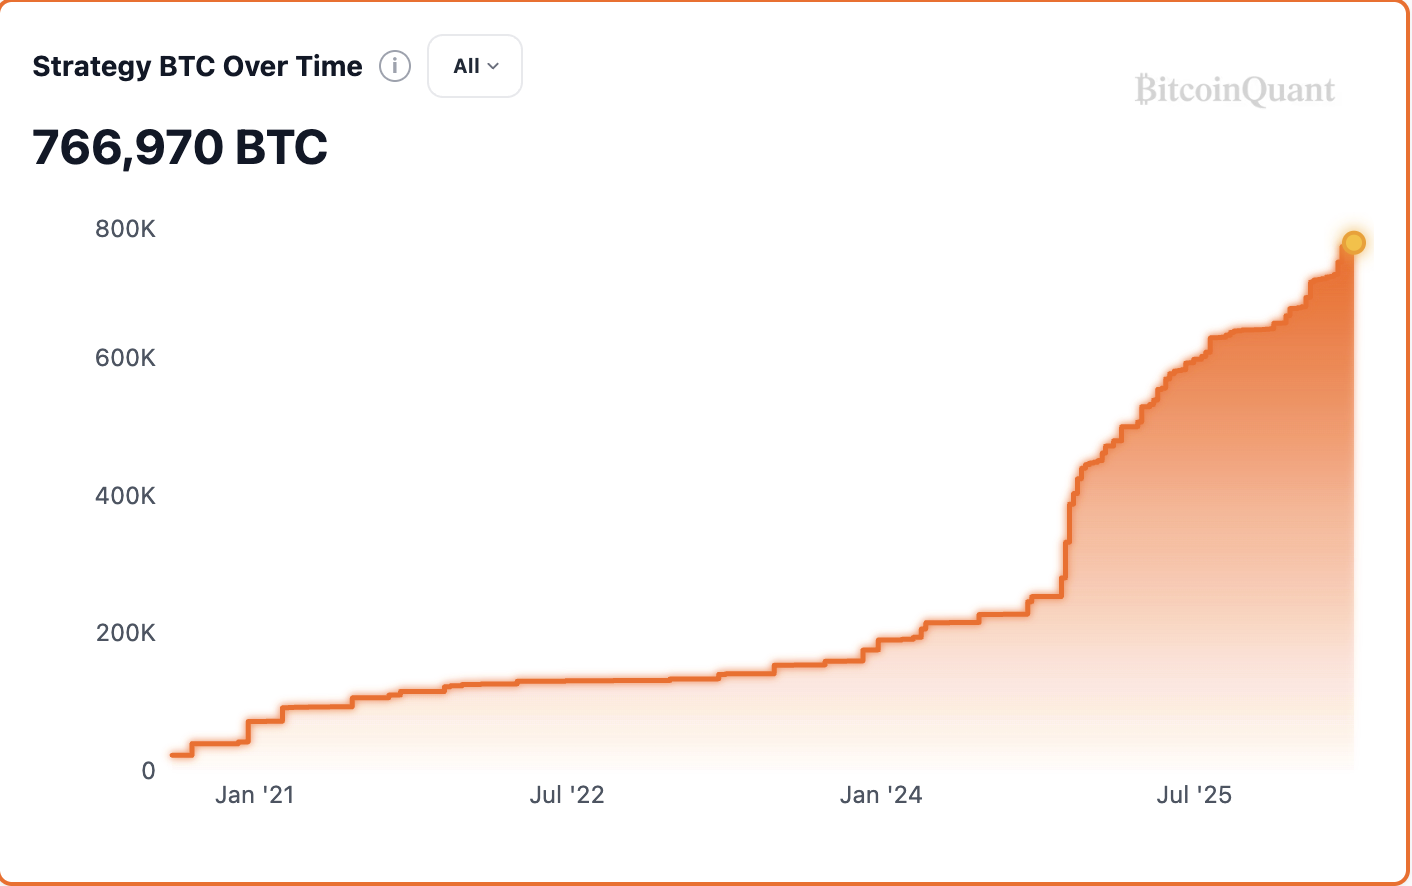
_Strategy’s BTC holdings chart. Source: _BitcoinQuant.CO
Much of that demand has come through STRC, Strategy’s variable-rate preferred stock. When STRC held near or above its $100 par value, Strategy kept issuing shares and accumulating BTC.
For instance, last week, Strategy raised $102.6 million through STRC sales to help fund a Bitcoin purchase worth over $330 million. BTC’s price has jumped by over 6.65% ever since.
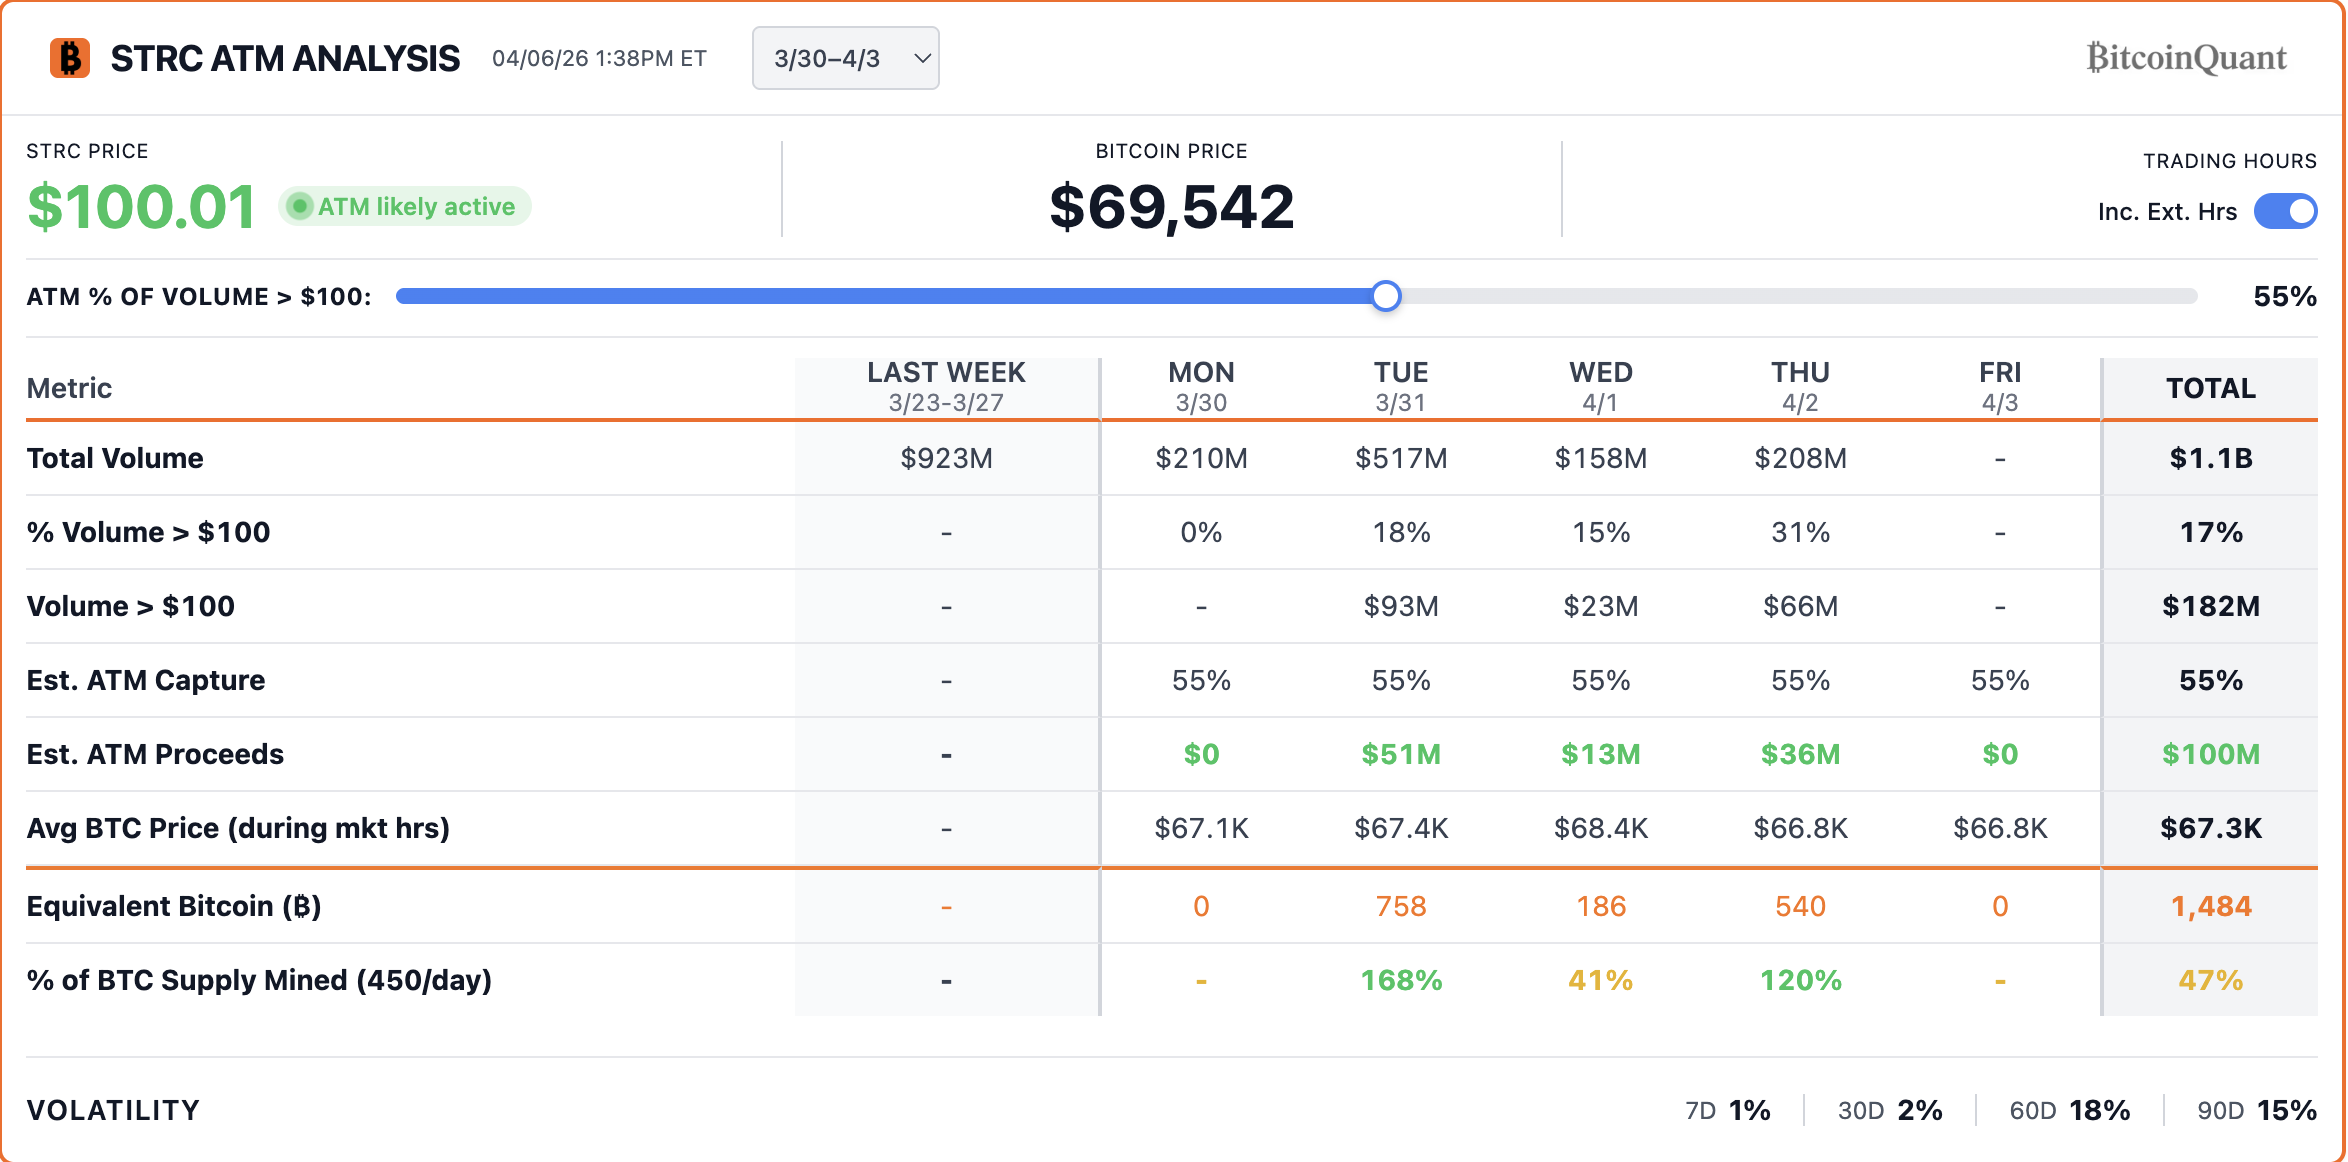
STRC at-the-market sales analysis. Source: BitcoinQuant.CO
During March 9–13, STRC sales raised about $776 million, enough to buy over 11,000 BTC, while Bitcoin rose more than 7% even as the S&P 500 fell 1.6%. The same period saw BTC’s price rising over 10.5%.
But when STRC slipped below par in mid-March, issuance slowed. Earlier below-par episodes had coincided with 25%–40% BTC pullbacks, including a nearly 40% drop over three weeks after a January pause.
Bitcoin’s long-term holders and whales drove much of the selling.
Bear flag failure could set stage for rally to $110,000
Bitcoin remains inside a bear flag after a sharp decline, but the pattern would begin to fail if price breaks above the upper trendline near the mid-$70,000 area.
That breakout would invalidate the immediate bearish continuation setup and shift focus to the bullish measured-move target near $108,000-$110,000.
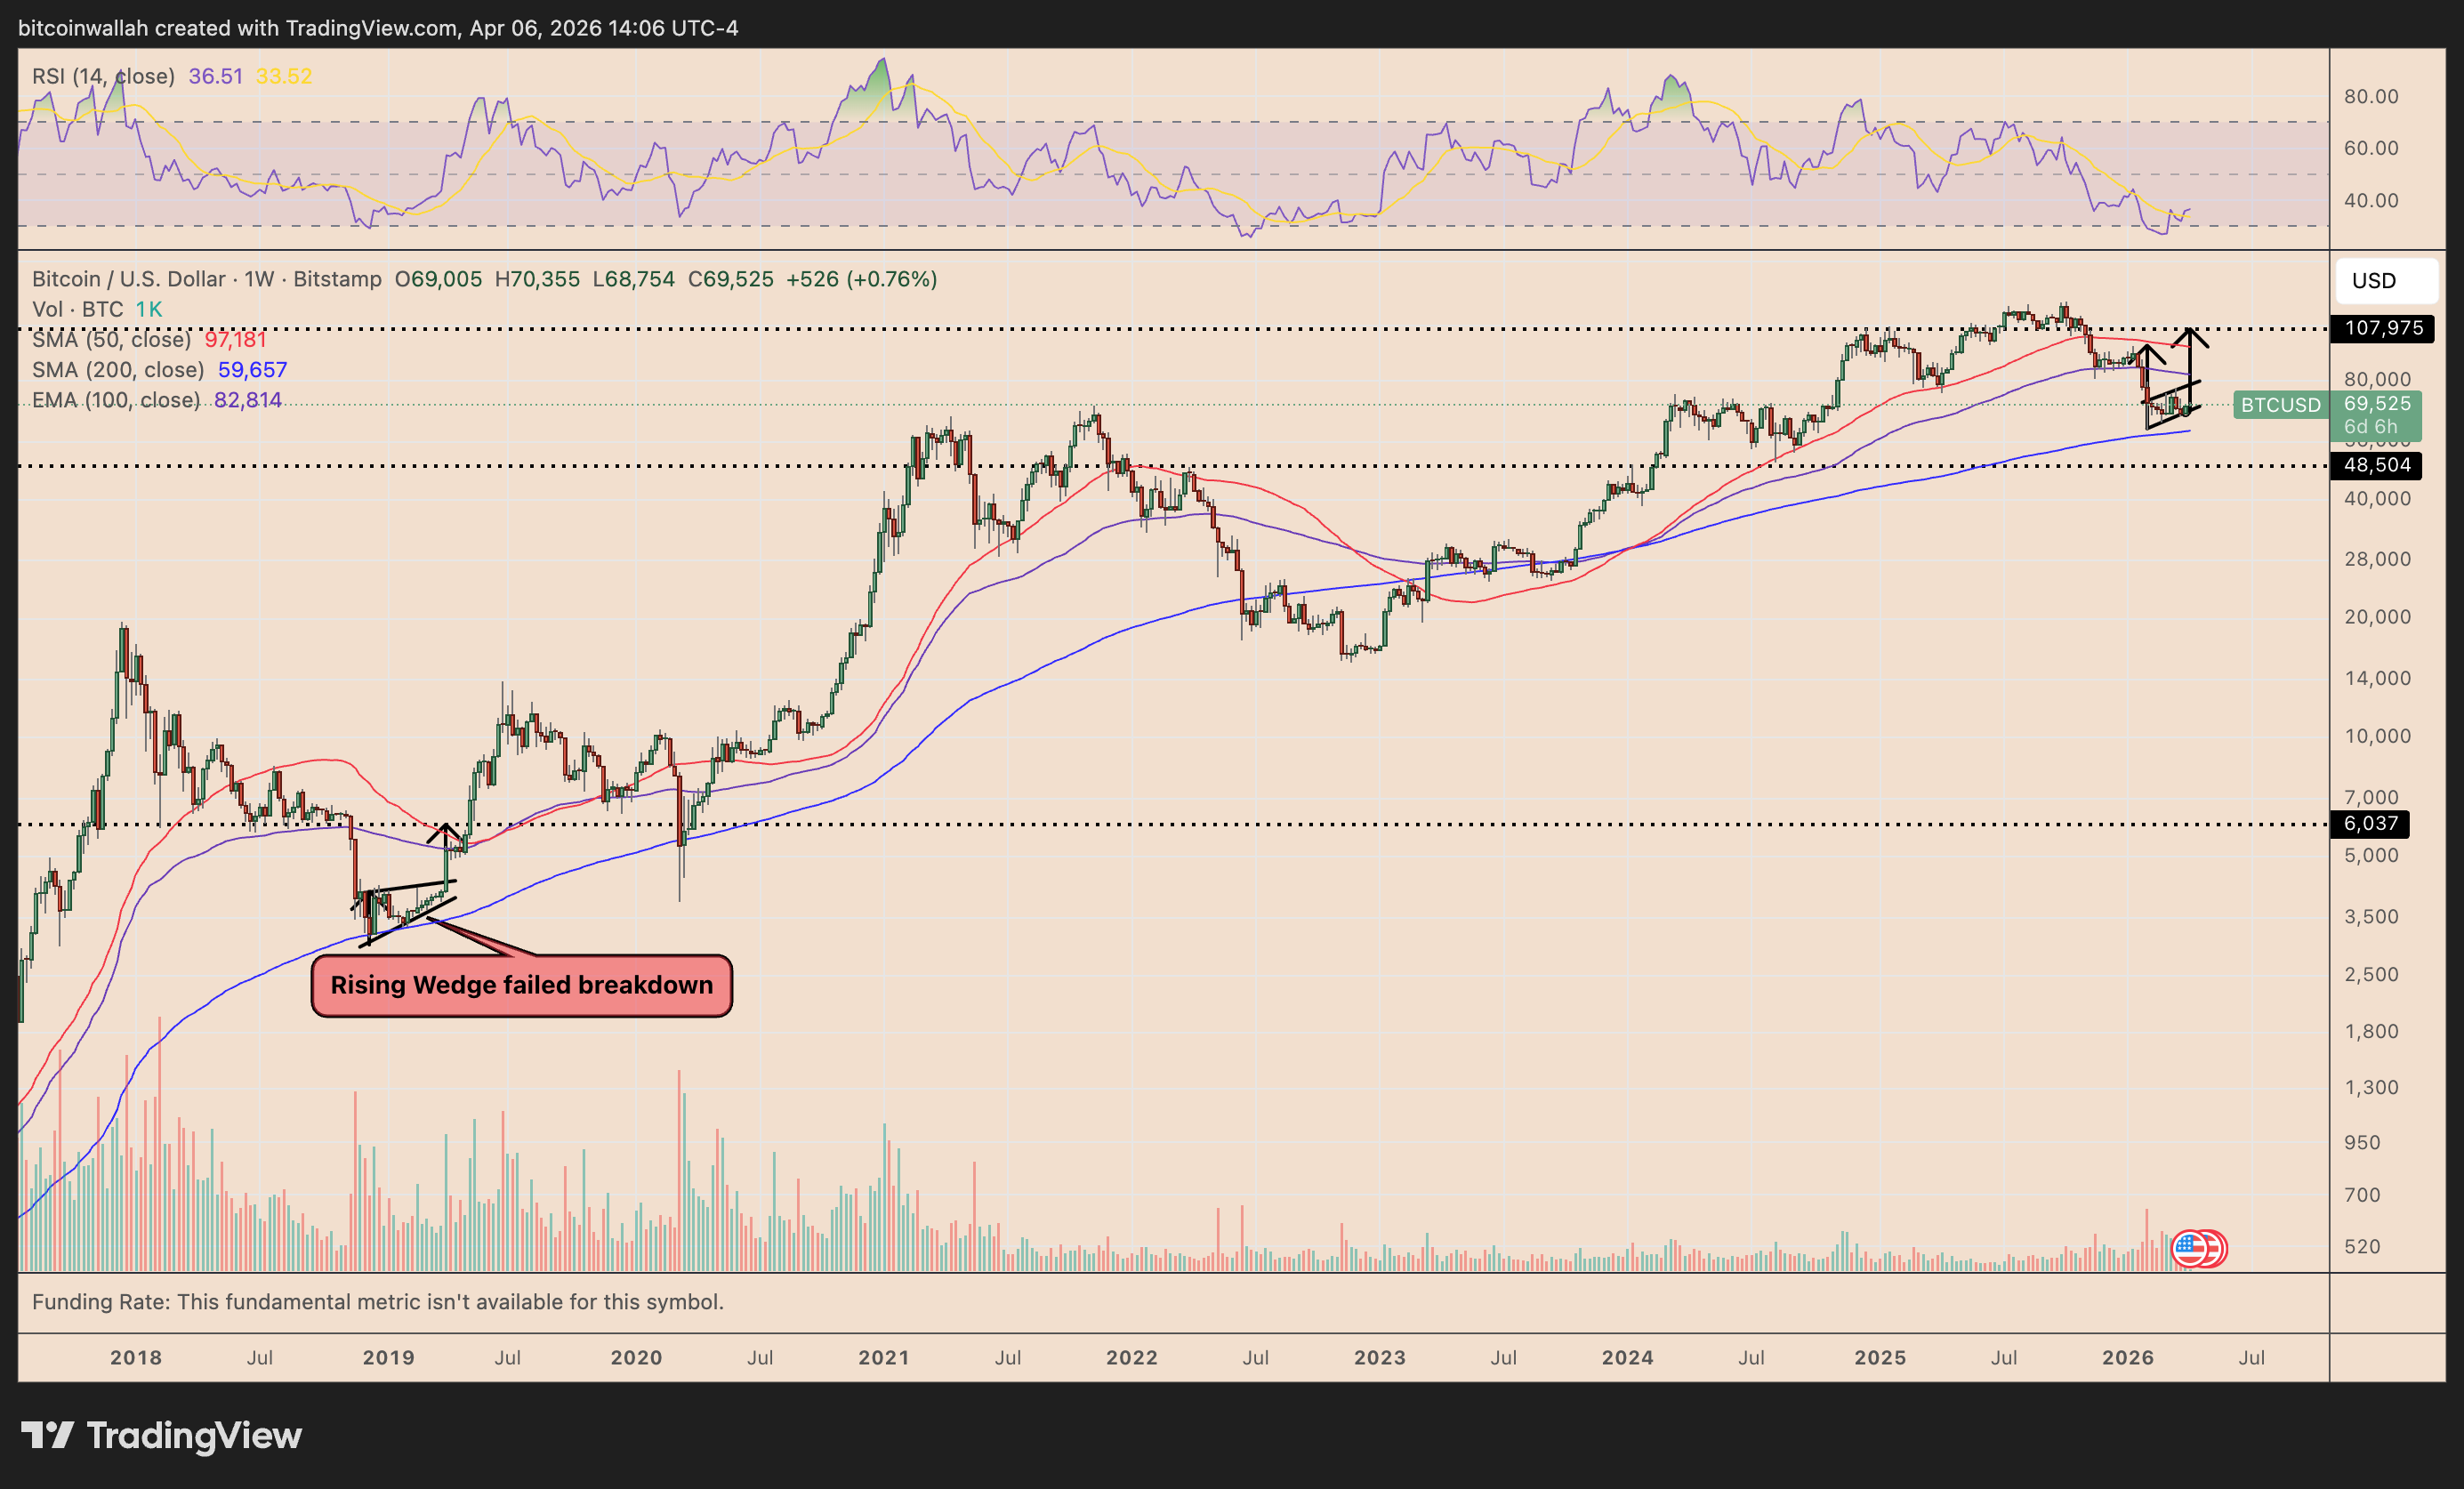
BTC/USD weekly price chart. TradingView
A similar pattern failure occurred near Bitcoin’s 2018 bottom, when a rising wedge pattern led to a breakout instead of a breakdown.
Another factor supporting the upside case is Bitcoin’s position near its 200-week simple moving average (200-week SMA, the blue wave). In 2018, Bitcoin bottomed out near this level and rose by over 1,975% afterward.
As of 2026, the 200-week SMA has capped Bitcoin’s downside attempts successfully, raising the odds of a 2018-like bottom formation.
**Related: **__Strategy’s STRC stock trading surge: How much Bitcoin can Saylor buy?
Some analysts anticipate BTC to rise to $400,000 if Strategy continues buying BTC at its current rate.
This article is produced in accordance with Cointelegraph’s Editorial Policy and is intended for informational purposes only. It does not constitute investment advice or recommendations. All investments and trades carry risk; readers are encouraged to conduct independent research before making any decisions. Cointelegraph makes no guarantees regarding the accuracy or completeness of the information presented, including forward-looking statements, and will not be liable for any loss or damage arising from reliance on this content.
- #Bitcoin
- #Bitcoin Price
- #Bitcoin Analysis
- #Markets
- #Tech Analysis
- #Market Analysis
- #MicroStrategy
- #Michael Saylor
Disclaimer: The information on this page may come from third parties and does not represent the views or opinions of Gate. The content displayed on this page is for reference only and does not constitute any financial, investment, or legal advice. Gate does not guarantee the accuracy or completeness of the information and shall not be liable for any losses arising from the use of this information. Virtual asset investments carry high risks and are subject to significant price volatility. You may lose all of your invested principal. Please fully understand the relevant risks and make prudent decisions based on your own financial situation and risk tolerance. For details, please refer to
Disclaimer.
Related Articles
BTC fell below 77000 USDT
Gate News bot message, Gate quotes show that BTC fell below 77000 USDT, trading at 76961.6 USDT.
CryptoRadar26m ago
NYSE Welcomes Morgan Stanley’s MSBT Launch as First Spot Bitcoin ETF Issued by a Major US Bank
Bank-backed bitcoin ETFs are accelerating institutional adoption and strengthening market credibility. The NYSE marked a new milestone as Morgan Stanley Investment Management rang the closing bell and celebrated the launch of MSBT, which the NYSE described as the first spot bitcoin ETF by a major
Coinpedia4h ago
BTC falls 0.49% in 15 minutes: fragile long leverage and active sell-off pressure resonate to weigh on the short term
From 18:00 to 18:15 (UTC) on 2026-04-17, the BTC price fluctuated and trended downward within the 77097.4 to 77573.2 USDT range. Over these 15 minutes, the return rate recorded -0.49%, and the amplitude reached 0.61%. During this period, market trading was active; short-term volatility was amplified, and trading attention increased significantly. The main driver behind this abnormal move is that the overall leverage structure is bearish and long positions are fragile. At present, the BTC perpetual contract funding rate has remained negative for 11 consecutive days, indicating that the bears have the upper hand in the market. In addition, futures open interest (OI) is about 628.3 billion USDT, which is at a historical high. During the anomaly window, trading volume increased noticeably. On-chain data shows large amounts of BTC flowing from long-term holder addresses to exchanges, suggesting that active sell orders may have triggered longs to passively reduce positions, amplifying downward price pressure. Moreover, institutional positioning enthusiasm in the mainstream contract market has cooled off; liquidity boundaries have tightened, causing large-trade activity to have an amplified effect on market volatility. In the options market, implied volatility rose to 39.81%, increasing demand for downside protection and reflecting a defensive posture among market participants. Macro-environment volatility and some capital flowing into safe-haven assets, together with the recent regulatory uncertainty-related historical events, reinforced the move, pushing overall market risk appetite lower. Current BTC leverage risks still remain. If, in the future, there are concentrated sell-offs, volatility may be further amplified. It is recommended to continue monitoring sustained high OI levels, the persistence of negative funding rates, and on-chain transfers of large amounts of funds, and to stay alert for whale behavior and any disruptions to market sentiment caused by macro-policy developments. For subsequent price action, please watch key support levels, institutional and whale on-chain moves, and relevant global market news, and guard against short-term risks.
GateNews5h ago
Bitcoin Liquidations Hit $815M as BTC Surges Above $78K Amid Iran Strait Opening
Over $815 million in leveraged cryptocurrency positions were liquidated recently, mainly due to short positions against Bitcoin. Markets improved as Iran reopened the Strait of Hormuz and Trump hinted at a deal with Iran, boosting Bitcoin prices significantly.
GateNews5h ago
Cardano Founder Hoskinson Warns BIP-361 Could Freeze 1.7M Bitcoin
Charles Hoskinson warned that Bitcoin's BIP-361 upgrade, meant to address quantum threats, is wrongly classified as a soft fork. It could freeze 1.7 million BTC, including 1 million from Satoshi Nakamoto, as early coin owners can't prove ownership.
GateNews6h ago
