
#BTCMarketAnalysis
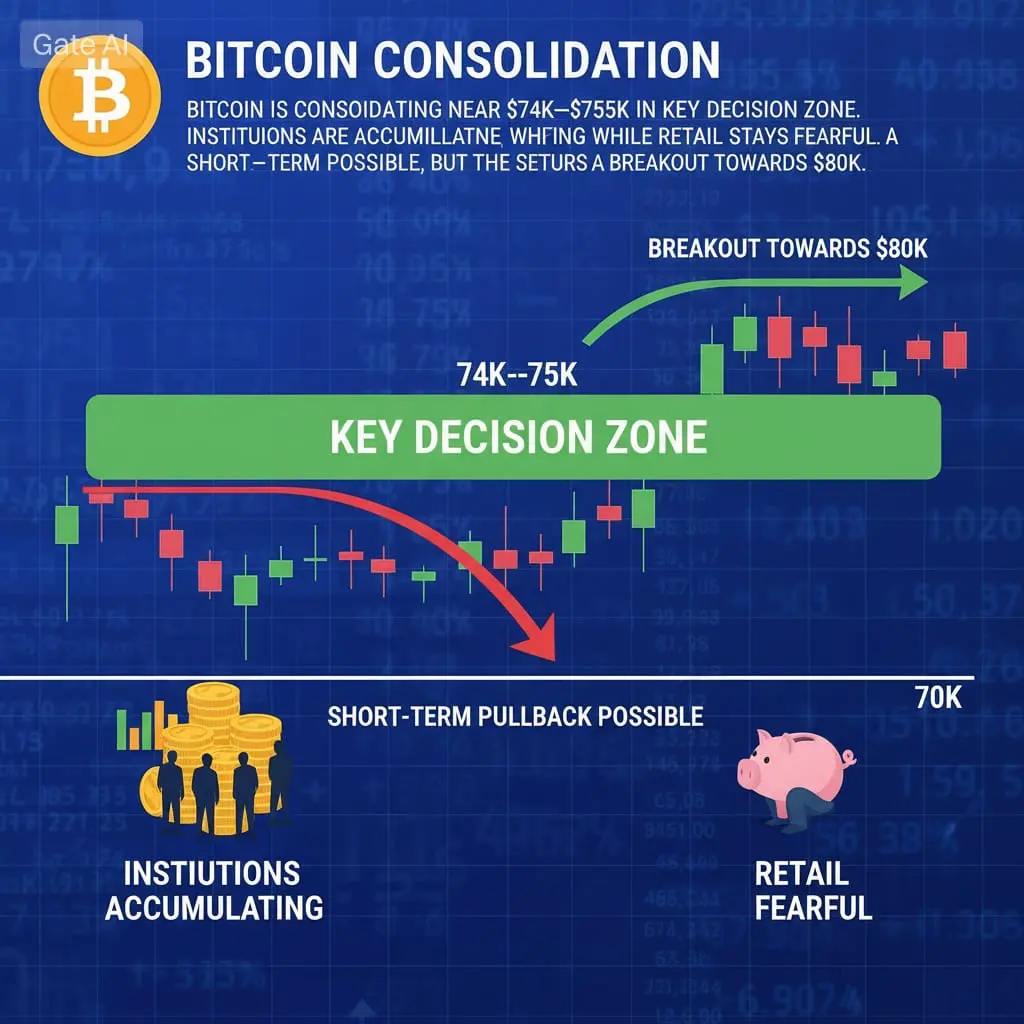
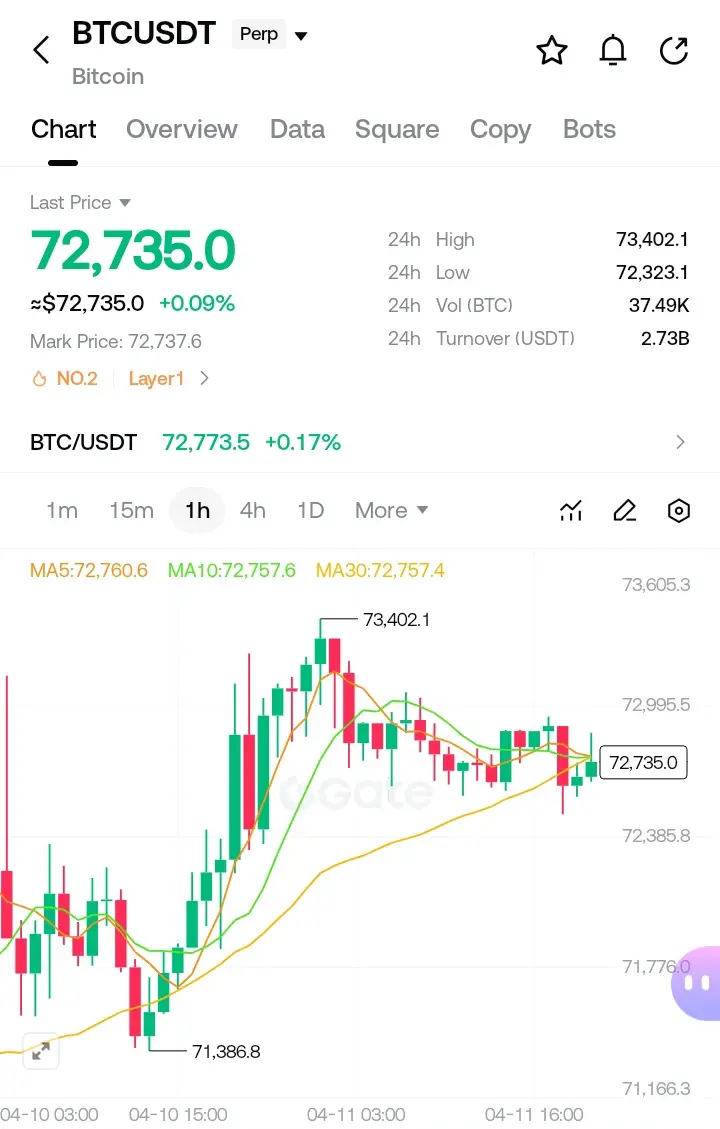
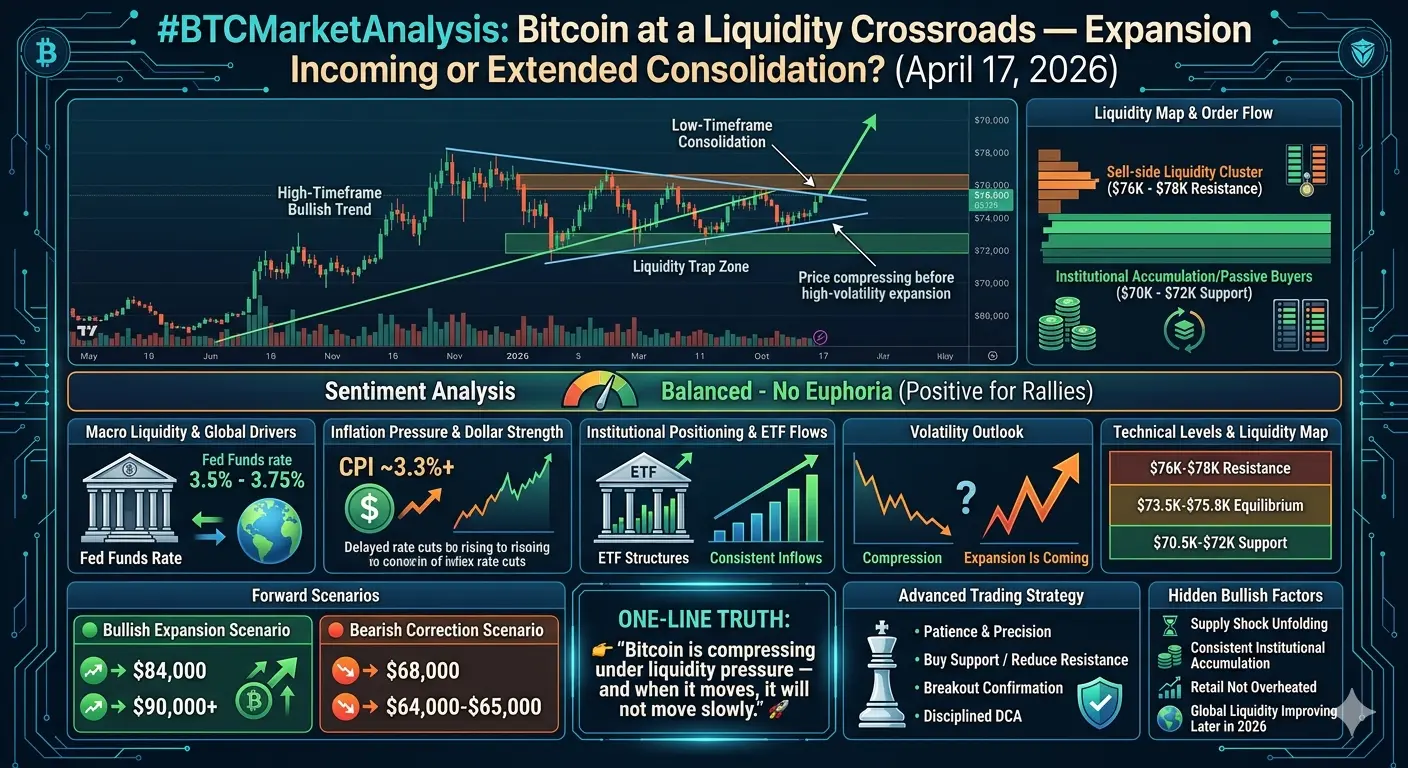
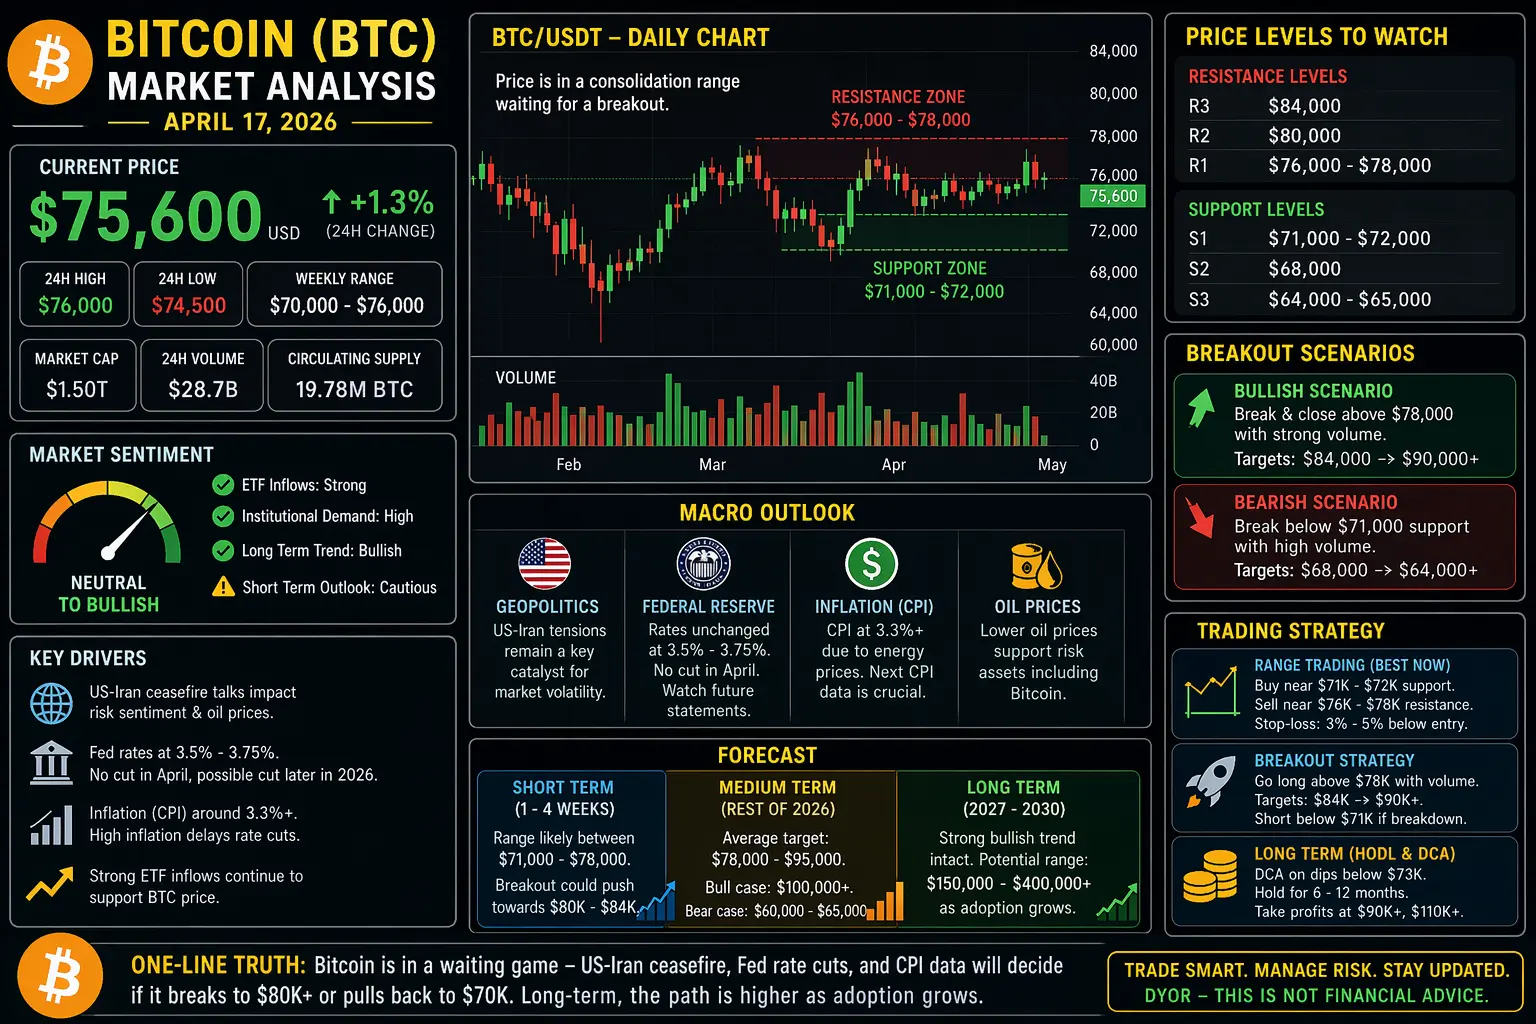
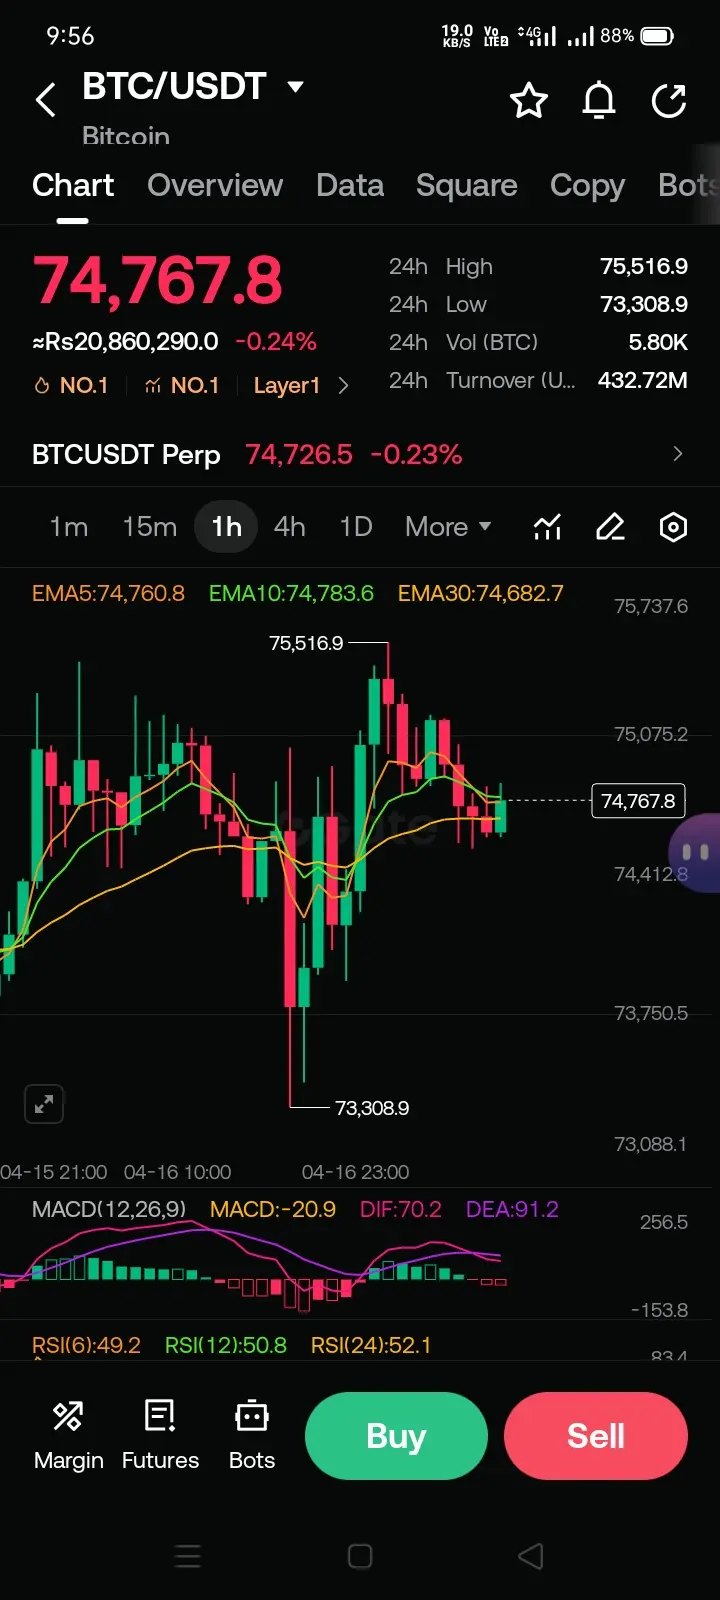
Bitcoin is currently trading around $74.5K, locked in a tight consolidation range between $74K–$75K.
This is not random sideways action — this is a decision zone.
Institutions are quietly accumulating
Retail remains hesitant and underexposed
Volatility is compressing → expansion coming soon
Historically, these compression phases precede explosive moves — direction depends on liquidity triggers.
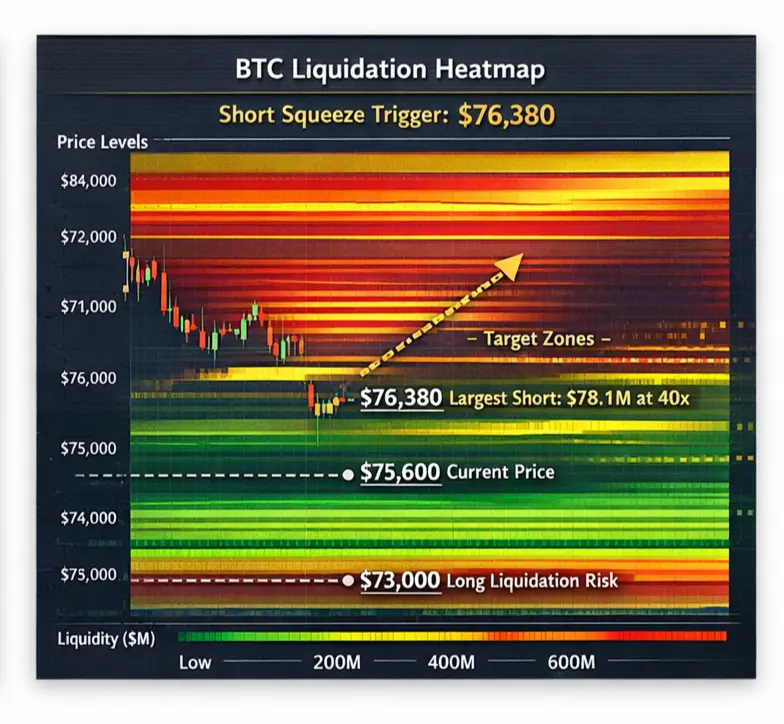
Liquidity Map & Order Flow (New Advanced Section)
This is where things get interesting.
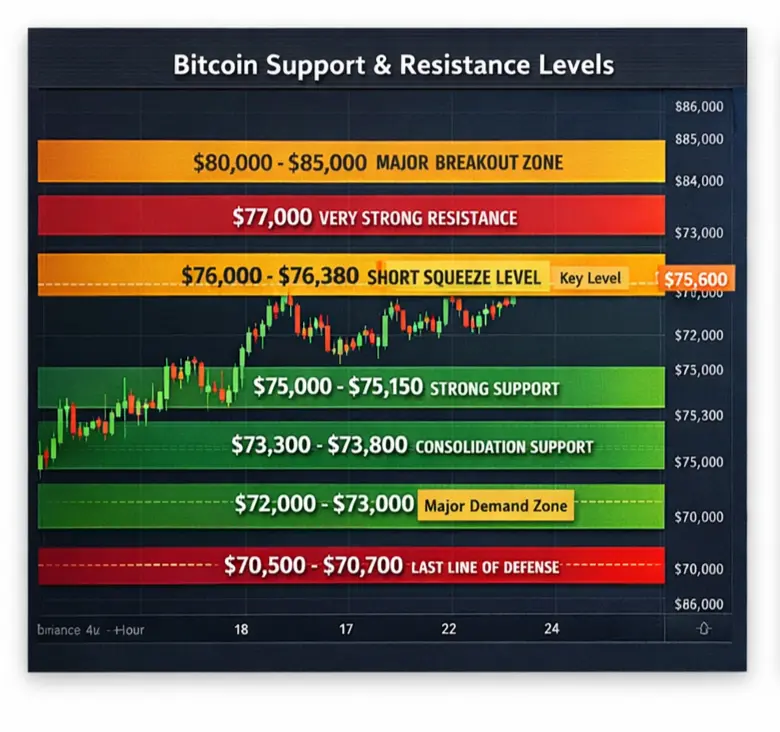
Major liquidity clusters:
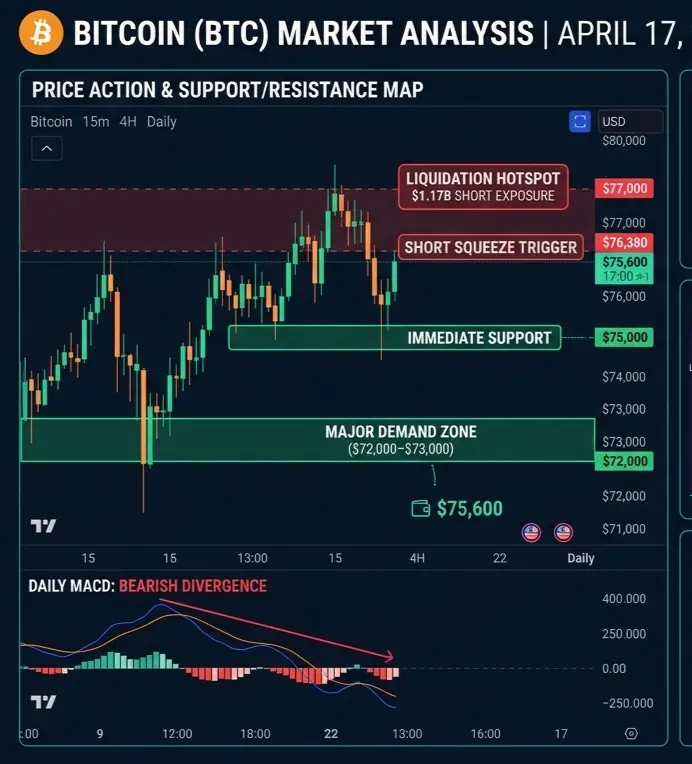
Above: $76K–$77K (stop hunts + breakout traders)
Below: $72K–$73K (late longs + weak hands)
Market makers typically: ➡️ Sweep liquidity first
➡️ Then move in the real direction
Implication: A fake move (either side) is highly likely before the real trend begins.
Technical Structure — Multi-Layer Confirmation
Short-Term Momentum (Bullish, but fragile)
Moving averages fully aligned (MA7 > MA30 > MA120)
ADX above 40 → strong trend strength
Volume confirms buying interest
However, momentum is losing efficiency — price is rising, but with slower follow-through.
Critical Warning Signals (Expanded)
Head & Shoulders Pattern
Neckline: ~$73,500
Breakdown = fast move to $71K–$72K liquidity zone
Overbought Conditions
CCI above 100
Williams %R near extremes
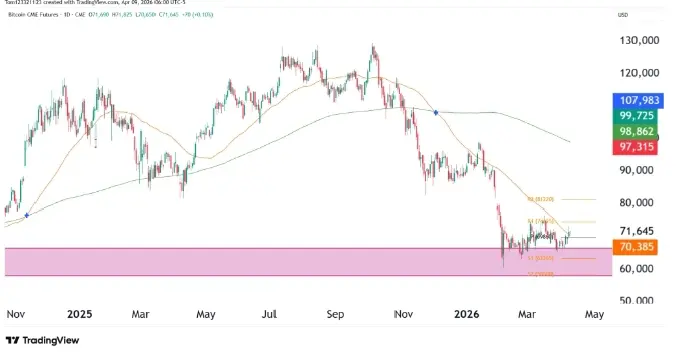
Parabolic SAR (Daily)
Still above price → trend not fully confirmed bullish on higher timeframe
Key Pivot Level
20-Day MA (~$74.7K) = immediate trend control
Volatility Compression Insight (New Section)
Bollinger Bands tightening on 4H and Daily → volatility squeeze forming
This typically leads to: ➡️ 5%–10% expansion move within days
The only question is direction — and that will be decided by liquidity + macro catalysts.
On-Chain Intelligence — Smart Money Behavior
The blockchain tells a very clear story:
60%+ BTC unmoved for 1 year
Exchange reserves declining → reduced sell pressure
Realized price far below current → strong profit cushion
Hash rate near ATH → network confidence extremely high
New Insight: Whale Wallet Behavior
Large wallets (1K+ BTC):
Net accumulation trend continues
No panic distribution seen
➡️ Translation: Smart money is not exiting — they are positioning
Institutional Flow Tracker (Enhanced)
Aggressive Accumulators:
MicroStrategy
Massive BTC absorption strategy
Effectively removing supply from circulation
BlackRock & Fidelity Investments
Consistent ETF inflows
Buying dips, not chasing pumps
Sell-Side Pressure:
Bhutan
Gradual distribution → manageable but persistent
➡️ Net effect: Demand > Supply (structurally bullish)
Market Psychology — The Real Edge
Current sentiment is the biggest clue:
Fear Index: Extreme Fear (~23)
Social activity: declining sharply
Retail participation: low
This creates a classic setup:
“When retail is afraid and inactive, institutions accumulate.”
New Psychological Layer
We are in a “Disbelief Phase” of the cycle:
Price rising slowly
Majority expecting a drop
Market climbing the “wall of worry”
This phase historically transitions into: ➡️ Acceleration phase (fast upside moves)
Macro Overlay — The Hidden Driver
Crypto is no longer isolated.
Key correlations:
BTC ↔ Nasdaq (risk-on behavior)
BTC ↔ Gold (store of value narrative)
Critical Catalysts:
Federal Reserve policy shifts
Inflation data surprises
Global liquidity expansion
➡️ A single dovish signal can trigger breakout above $76K instantly
Regulatory Expansion — Pakistan Angle (Enhanced)
The legalization narrative is underestimated.
Opens new retail + institutional demand
Enables local exchange growth
Bridges global liquidity access
But Reality Check:
Regulatory clarity still evolving
Taxation framework not fully defined
Banking integration remains a friction point
➡️ Net effect: Long-term bullish, short-term neutral
BTC Dominance & Altcoin Rotation (Deeper Insight)
BTC dominance holding strong (~58–60%)
No full alt-season yet
What Happens Next:
BTC breaks $76K → dominance rises → alts lag
BTC consolidates → capital rotates → alts outperform
Key Insight:
Alt-season doesn’t start when BTC pumps —
It starts when BTC stabilizes after pumping.
Risk Matrix (New Section — Professional Upgrade)
Bullish Risks (Upside Drivers):
ETF inflow acceleration
Institutional FOMO
Macro easing
Bearish Risks (Downside Triggers):
Head & Shoulders breakdown
Sudden macro shock
Regulatory uncertainty (global)
Neutral Risks:
Prolonged sideways → trader exhaustion
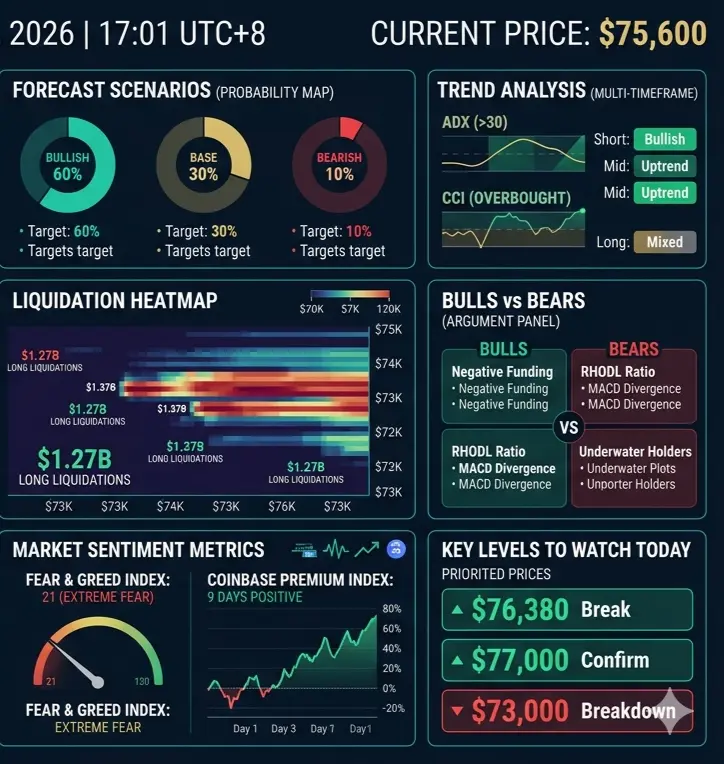
Price Scenarios (Refined with Market Logic)
Bull Case (55%)
Break $76K → momentum ignition
Target: $80K–$85K
Base Case (30%)
Range-bound liquidity build
$72K–$77K
Bear Case (15%)
Liquidity sweep below $73K
Quick dip → recovery likely
Execution Strategy (Sharpened)
For Smart Buyers:
Avoid emotional entries at resistance
Accumulate at liquidity zones ($72.5K–$73.5K)
For Traders:
Trade the range until breakout
Expect fakeouts before real move
For Long-Term Holders:
Structure unchanged → bullish
Focus on accumulation, not noise
Next 7–10 Days — What Actually Matters
$76K breakout with volume
$73K breakdown confirmation
ETF flow consistency
Institutional buying updates
Macro headlines (especially Fed tone)
Final Verdict — Elevated Perspective
Bitcoin is not weak — it is coiling.
Supply is tightening
Institutions are accumulating
Retail is absent
Volatility is compressing
This combination historically leads to: ➡️ Explosive upside expansion
Most Probable Path:
Short-term pullback or fake breakdown
Liquidity sweep
Strong breakout toward $80K+
Closing Insight (New Addition)
The market right now is not rewarding speed —
It is rewarding patience and positioning.
Those chasing momentum will likely get trapped.
Those waiting for structure will likely win.
Bottom Line:
Bitcoin is in a pre-expansion phase.
The move hasn’t started yet — but the setup is almost complete.
Bitcoin is currently trading around $74.5K, locked in a tight consolidation range between $74K–$75K.
This is not random sideways action — this is a decision zone.
Institutions are quietly accumulating
Retail remains hesitant and underexposed
Volatility is compressing → expansion coming soon
Historically, these compression phases precede explosive moves — direction depends on liquidity triggers.
Liquidity Map & Order Flow (New Advanced Section)
This is where things get interesting.
Major liquidity clusters:
Above: $76K–$77K (stop hunts + breakout traders)
Below: $72K–$73K (late longs + weak hands)
Market makers typically: ➡️ Sweep liquidity first
➡️ Then move in the real direction
Implication: A fake move (either side) is highly likely before the real trend begins.
Technical Structure — Multi-Layer Confirmation
Short-Term Momentum (Bullish, but fragile)
Moving averages fully aligned (MA7 > MA30 > MA120)
ADX above 40 → strong trend strength
Volume confirms buying interest
However, momentum is losing efficiency — price is rising, but with slower follow-through.
Critical Warning Signals (Expanded)
Head & Shoulders Pattern
Neckline: ~$73,500
Breakdown = fast move to $71K–$72K liquidity zone
Overbought Conditions
CCI above 100
Williams %R near extremes
Parabolic SAR (Daily)
Still above price → trend not fully confirmed bullish on higher timeframe
Key Pivot Level
20-Day MA (~$74.7K) = immediate trend control
Volatility Compression Insight (New Section)
Bollinger Bands tightening on 4H and Daily → volatility squeeze forming
This typically leads to: ➡️ 5%–10% expansion move within days
The only question is direction — and that will be decided by liquidity + macro catalysts.
On-Chain Intelligence — Smart Money Behavior
The blockchain tells a very clear story:
60%+ BTC unmoved for 1 year
Exchange reserves declining → reduced sell pressure
Realized price far below current → strong profit cushion
Hash rate near ATH → network confidence extremely high
New Insight: Whale Wallet Behavior
Large wallets (1K+ BTC):
Net accumulation trend continues
No panic distribution seen
➡️ Translation: Smart money is not exiting — they are positioning
Institutional Flow Tracker (Enhanced)
Aggressive Accumulators:
MicroStrategy
Massive BTC absorption strategy
Effectively removing supply from circulation
BlackRock & Fidelity Investments
Consistent ETF inflows
Buying dips, not chasing pumps
Sell-Side Pressure:
Bhutan
Gradual distribution → manageable but persistent
➡️ Net effect: Demand > Supply (structurally bullish)
Market Psychology — The Real Edge
Current sentiment is the biggest clue:
Fear Index: Extreme Fear (~23)
Social activity: declining sharply
Retail participation: low
This creates a classic setup:
“When retail is afraid and inactive, institutions accumulate.”
New Psychological Layer
We are in a “Disbelief Phase” of the cycle:
Price rising slowly
Majority expecting a drop
Market climbing the “wall of worry”
This phase historically transitions into: ➡️ Acceleration phase (fast upside moves)
Macro Overlay — The Hidden Driver
Crypto is no longer isolated.
Key correlations:
BTC ↔ Nasdaq (risk-on behavior)
BTC ↔ Gold (store of value narrative)
Critical Catalysts:
Federal Reserve policy shifts
Inflation data surprises
Global liquidity expansion
➡️ A single dovish signal can trigger breakout above $76K instantly
Regulatory Expansion — Pakistan Angle (Enhanced)
The legalization narrative is underestimated.
Opens new retail + institutional demand
Enables local exchange growth
Bridges global liquidity access
But Reality Check:
Regulatory clarity still evolving
Taxation framework not fully defined
Banking integration remains a friction point
➡️ Net effect: Long-term bullish, short-term neutral
BTC Dominance & Altcoin Rotation (Deeper Insight)
BTC dominance holding strong (~58–60%)
No full alt-season yet
What Happens Next:
BTC breaks $76K → dominance rises → alts lag
BTC consolidates → capital rotates → alts outperform
Key Insight:
Alt-season doesn’t start when BTC pumps —
It starts when BTC stabilizes after pumping.
Risk Matrix (New Section — Professional Upgrade)
Bullish Risks (Upside Drivers):
ETF inflow acceleration
Institutional FOMO
Macro easing
Bearish Risks (Downside Triggers):
Head & Shoulders breakdown
Sudden macro shock
Regulatory uncertainty (global)
Neutral Risks:
Prolonged sideways → trader exhaustion
Price Scenarios (Refined with Market Logic)
Bull Case (55%)
Break $76K → momentum ignition
Target: $80K–$85K
Base Case (30%)
Range-bound liquidity build
$72K–$77K
Bear Case (15%)
Liquidity sweep below $73K
Quick dip → recovery likely
Execution Strategy (Sharpened)
For Smart Buyers:
Avoid emotional entries at resistance
Accumulate at liquidity zones ($72.5K–$73.5K)
For Traders:
Trade the range until breakout
Expect fakeouts before real move
For Long-Term Holders:
Structure unchanged → bullish
Focus on accumulation, not noise
Next 7–10 Days — What Actually Matters
$76K breakout with volume
$73K breakdown confirmation
ETF flow consistency
Institutional buying updates
Macro headlines (especially Fed tone)
Final Verdict — Elevated Perspective
Bitcoin is not weak — it is coiling.
Supply is tightening
Institutions are accumulating
Retail is absent
Volatility is compressing
This combination historically leads to: ➡️ Explosive upside expansion
Most Probable Path:
Short-term pullback or fake breakdown
Liquidity sweep
Strong breakout toward $80K+
Closing Insight (New Addition)
The market right now is not rewarding speed —
It is rewarding patience and positioning.
Those chasing momentum will likely get trapped.
Those waiting for structure will likely win.
Bottom Line:
Bitcoin is in a pre-expansion phase.
The move hasn’t started yet — but the setup is almost complete.