XRP price establishes support above $2: Flag pattern suggests the next breakout

Last Updated 2026-03-27 12:04:02
Reading Time: 1m
XRP is consolidating above the key $2 support level, forming a flag pattern. This article provides a comprehensive analysis of this technical setup, potential breakout targets, and key signals for investors to monitor.

What Is a Pennant Pattern?


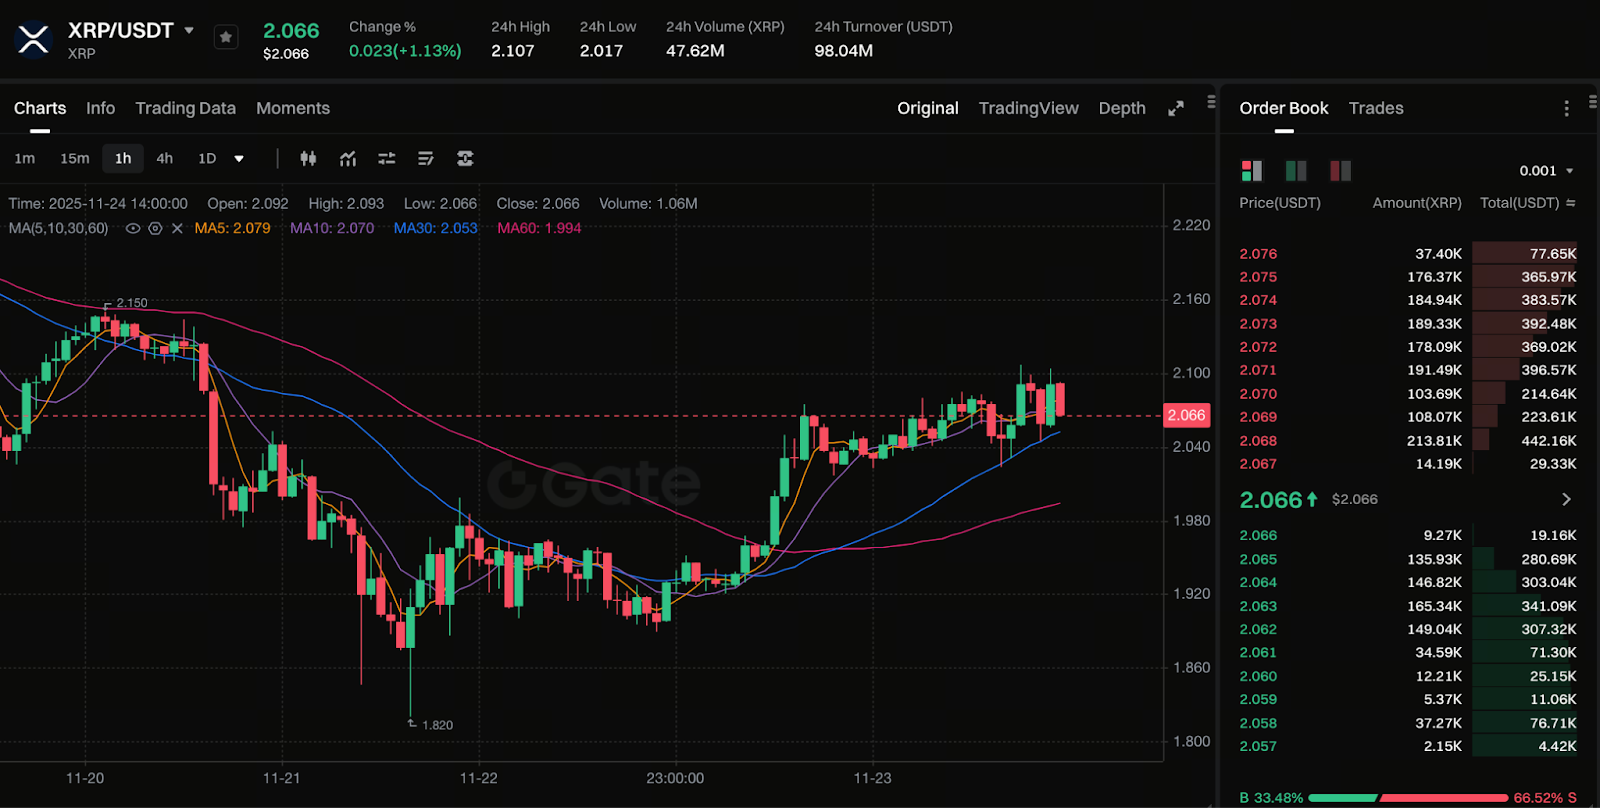
Chart: https://www.gate.com/trade/XRP_USDT

A pennant pattern is a classic continuation formation that typically emerges after a significant price surge or decline. In this setup, price consolidates between two converging trendlines as trading volume gradually contracts, signaling the market is awaiting direction. Once the pennant completes, price often resumes movement in line with the prevailing trend. Key features include:

  • Clear prior trend: A distinct upward or downward move precedes the pennant.
  • Converging consolidation: The upper and lower trendlines draw closer together, narrowing price swings.
  • Declining volume: Volume drops during consolidation and expands on breakout.

Currently, XRP is in a post-rally consolidation phase. The trendlines are converging and volume is shrinking, matching the textbook pennant characteristics.

XRP Price Action and Support Analysis

XRP is currently fluctuating above the critical $2 support. After several tests of the $2 level, buyers have stepped in, establishing a lower trendline. Meanwhile, the upper trendline is narrowing, forming a complete pennant pattern. Overhead resistance is in the $2.30–$2.40 range.

Short-term consolidation above support suggests the market is gauging the balance of bullish and bearish forces. If support holds, bulls gain confidence and conditions favor another upward move. If support breaks, the pennant formation fails and price could shift into a downward correction.

What Does a Pennant Pattern Signify?

The presence of a pennant usually signals a likely continuation of the trend. For XRP:

  • Support holds: The $2 level has been tested repeatedly and buyers have consistently defended it.
  • Consolidation and convergence: Price is tightening between the upper and lower trendlines with shrinking volume, showing the market is awaiting a breakout.
  • Upward bias: Given the strong prior uptrend, the pennant typically suggests trend continuation to the upside.

However, a pennant does not guarantee a successful breakout. Investors should closely monitor whether key support remains intact and evaluate volume during any breakout move.

XRP Potential Breakout Targets and Risk Warnings

Technical analysis indicates that if XRP breaks above the pennant’s upper boundary and confirms an uptrend, the near-term target is $2.60–$2.65. Should the breakout accelerate with strong volume, higher targets are possible.

Risk factors include:

  • If $2 support fails, the pennant pattern is invalidated and price could retreat to the $1.80–$1.90 range.
  • Overall market shifts—such as changes in crypto sentiment, macroeconomic trends, or regulatory developments—can also impact price direction.

Investors should monitor support, resistance, and volume dynamics closely, and integrate risk management into their strategies.

Key Signals for Investors

  • Breakout confirmation on close: A daily or weekly close above the upper trendline confirms a valid breakout.
  • Breakout with strong volume: Rising volume signals robust buying and increases breakout reliability.
  • Support maintained: Sustained defense of the $2 support reduces the risk of a downside move.
  • Macro market factors: Policy, sentiment, and liquidity conditions continue to influence breakout direction.

Summary: XRP is forming a pennant above $2. A breakout may usher in a new rally, but investors should remain cautious about the risk of a pullback if support fails. Combine technical analysis with robust risk management to develop effective trading strategies.

Author: Max
Disclaimer
* The information is not intended to be and does not constitute financial advice or any other recommendation of any sort offered or endorsed by Gate.
* This article may not be reproduced, transmitted or copied without referencing Gate. Contravention is an infringement of Copyright Act and may be subject to legal action.

Related Articles

What is Fartcoin? All You Need to Know About FARTCOIN
Intermediate

What is Fartcoin? All You Need to Know About FARTCOIN

Fartcoin (FARTCOIN) is a representative meme coin within the Solana ecosystem based on an AI-driven narrative. Its core concept originated from an experiment aimed at exploring the "boundaries between AI Agents and humor." More than just a digital asset with social attributes, the project deeply couples absurd humor culture with on-chain financial logic by integrating autonomous AI interaction models.
2026-04-04 22:01:19
Gold Price Forecast for the Next Five Years: 2026–2030 Trend Outlook and Investment Implications, Could It Reach $6,000?
Beginner

Gold Price Forecast for the Next Five Years: 2026–2030 Trend Outlook and Investment Implications, Could It Reach $6,000?

Analyze current gold price trends alongside authoritative five-year forecasts, integrating an evaluation of market risks and opportunities. This gives investors insight into the potential trajectory of gold prices and the main drivers expected to shape the market over the next five years.
2026-03-25 18:13:30
Aster vs Hyperliquid: Which Perp DEX Will Prevail?
Beginner

Aster vs Hyperliquid: Which Perp DEX Will Prevail?

Aster and Hyperliquid are the two representative protocols of the "purpose-built L1 path" within the current decentralized perpetual exchange (Perp DEX) sector. As a pioneer in the field, Hyperliquid has built a deep liquidity moat through its highly mature order book architecture and strong community consensus. Conversely, Aster, as a rising challenger, seeks to leapfrog the competition in high-performance trading through more aggressive multi-chain aggregation logic, private transaction modules, and an underlying execution environment optimized for 2026 market demands.
2026-03-24 11:58:33
2026 Silver Price Forecast: Bull Market Continuation or High-Level Pullback? In-Depth Analysis of Silver Candlestick Chart
Beginner

2026 Silver Price Forecast: Bull Market Continuation or High-Level Pullback? In-Depth Analysis of Silver Candlestick Chart

2026 Silver Price Forecast: Latest Outlook This article integrates current market trends, silver candlestick chart analysis, and momentum factors to assess the potential key support and resistance levels, upside targets, and pullback risks for silver prices. The goal is to help investors make informed, rational decisions.
2026-03-25 16:08:59
ASTER Tokenomics: Buybacks, Burns, and Staking as the Value Foundation of ASTER in 2026
Beginner

ASTER Tokenomics: Buybacks, Burns, and Staking as the Value Foundation of ASTER in 2026

ASTER is the native equity and governance token of the Aster ecosystem, with its core value built upon a radical "Deflationary Engine." Beyond serving as a governance tool, ASTER integrates multiple utilities including staking rewards, trading fee discounts, and liquidity incentives. Through its deep integration with the upcoming dedicated Layer 1 mainnet, it enables direct value capture from protocol cash flow to token holders.
2026-03-25 07:38:07
Crypto Future Profit Calculator: How to Calculate Your Potential Gains
Beginner

Crypto Future Profit Calculator: How to Calculate Your Potential Gains

Crypto Future Profit Calculator helps traders estimate potential earnings from futures contracts by considering entry price, leverage, fees, and market movement.
2026-04-03 23:27:09