The article provides an in-depth analysis of Nibiru Chain (NIBI), focusing on its current market position, historical price patterns, and potential future valuation until 2030. It addresses investment strategies tailored for long-term and active traders, along with risk management frameworks. Key factors influencing NIBI's price include ecosystem growth, technology development, and market sentiment. Suitable for investors with varying risk tolerances, the article highlights opportunities in NIBI's unique Layer-1 blockchain features. Enhance your investment decisions by understanding the project's trajectory and applying actionable strategies through Gate.
Introduction: Market Position and Investment Value of NIBI
Nibiru Chain (NIBI), functioning as a breakthrough L1 blockchain and smart contract ecosystem, has been delivering superior throughput and unparalleled security since its mainnet launch. As of December 2025, NIBI has achieved a market capitalization of approximately $2.26 million, with a circulating supply of around 186.69 million tokens, maintaining a price point of $0.012107. This asset, recognized as a "developer-friendly and user-friendly smart contract platform," is playing an increasingly critical role in the Web3 ecosystem.
This article will provide a comprehensive analysis of NIBI's price trajectory through 2030, integrating historical price patterns, market supply and demand dynamics, ecosystem development, and macroeconomic factors to deliver professional price forecasts and actionable investment strategies for market participants.
Nibiru Chain (NIBI) Market Analysis Report
I. NIBI Price History Review and Current Market Status
NIBI Historical Price Evolution Trajectory
- March 2024: Token launch and initial market entry, with NIBI reaching its all-time high (ATH) of $1.032 on March 12, 2024.
- August 2025: Market correction phase, NIBI reached its all-time low (ATL) of $0.008219 on August 14, 2025.
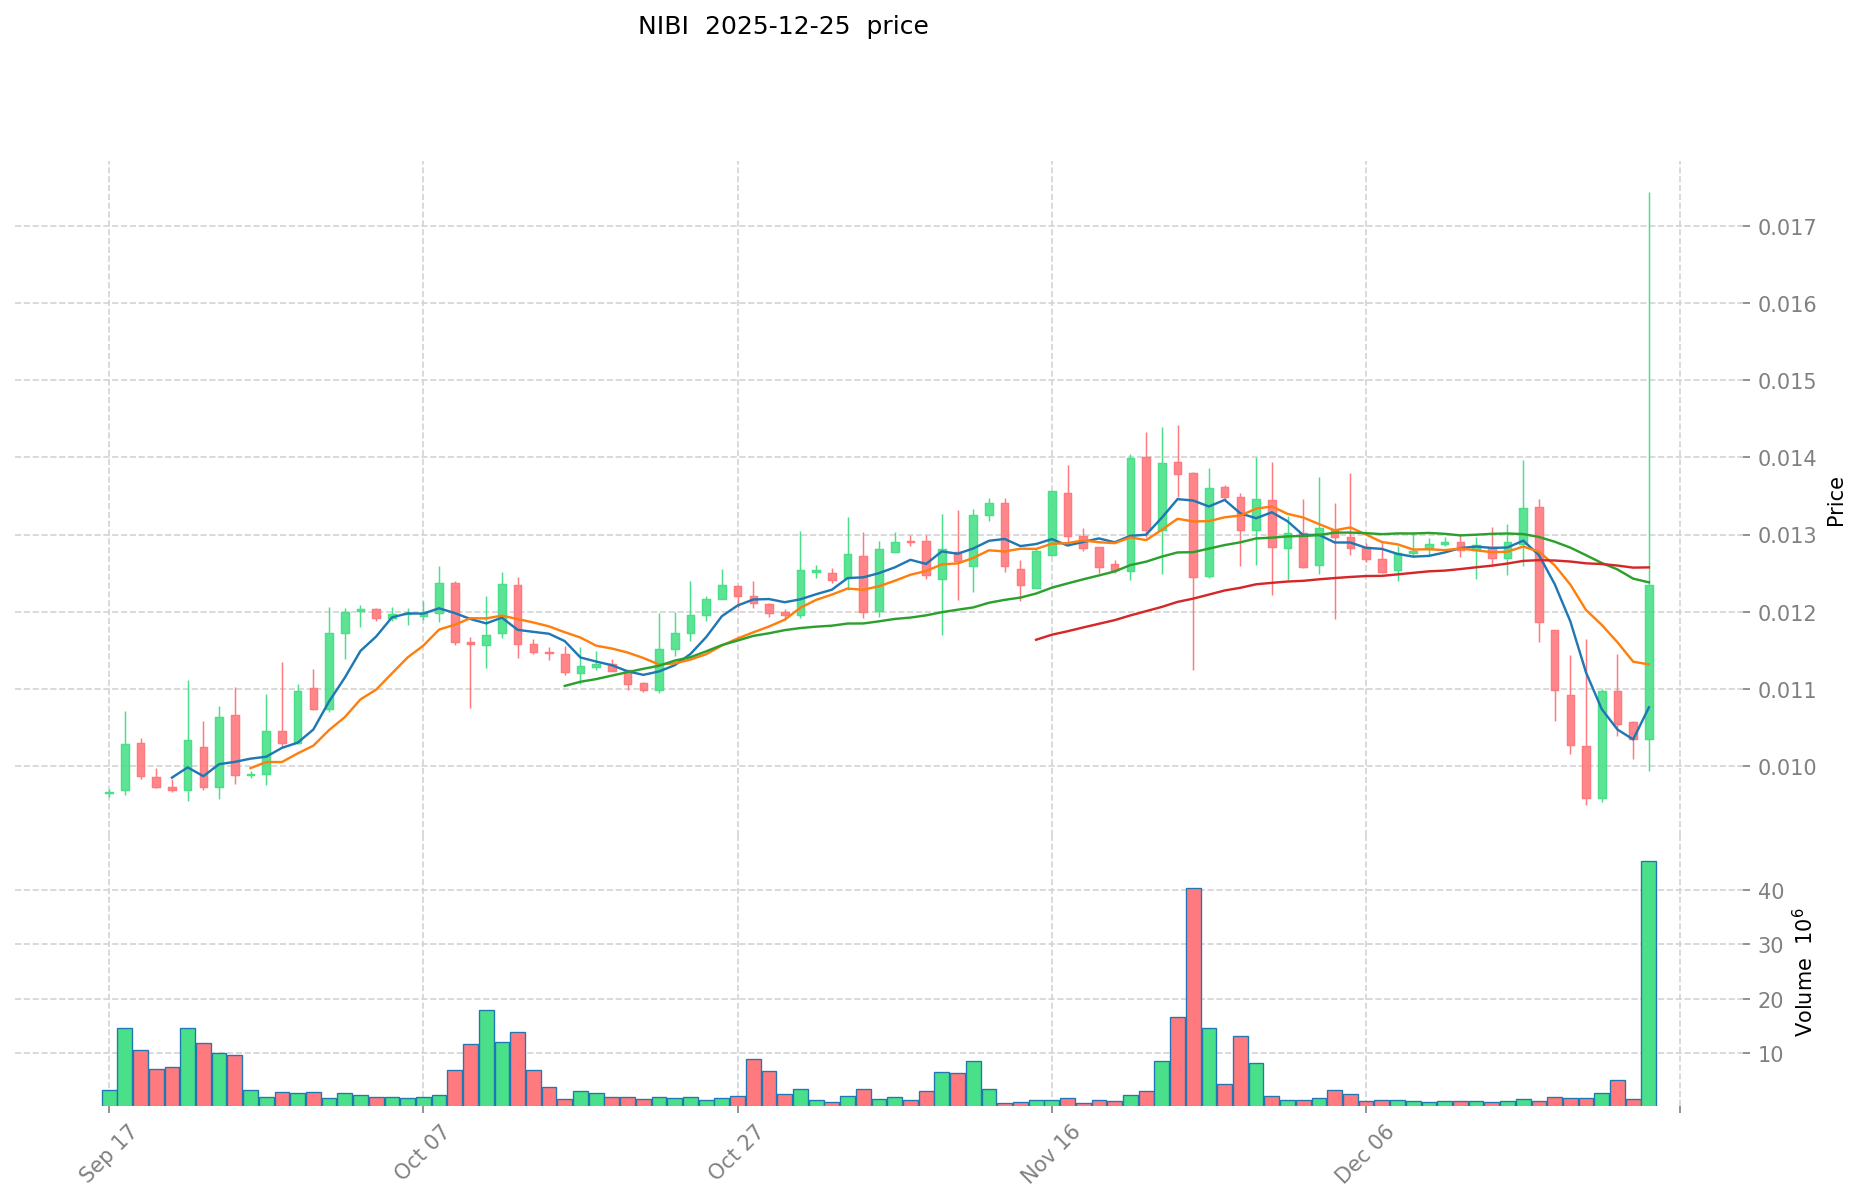
- December 2025: Recovery and consolidation period, price trading in the range between the recent lows and mid-range valuations.
NIBI Current Market Posture
As of December 25, 2025, NIBI is trading at $0.012107, representing a 24-hour price increase of 19.86%. The token has demonstrated short-term volatility with a 1-hour decline of 1.54%, while maintaining positive momentum over the 7-day period with a 4.91% gain. However, the 30-day performance shows a decline of 12.22%, and year-to-date performance reflects a significant 78.63% decrease from the token's launch price.
The 24-hour trading volume stands at $1,199,905.76, with NIBI maintaining a circulating supply of 186,694,846 tokens out of a total supply of 1,500,000,000. The current market capitalization is $2,260,314.50, while the fully diluted valuation reaches $18,160,500, placing NIBI at rank 2,060 in the broader cryptocurrency market. The market capitalization represents approximately 12.45% of the fully diluted valuation, indicating that a substantial portion of tokens remain in circulation reserves.
Nibiru Chain continues to operate as a Layer 1 blockchain ecosystem focused on delivering superior throughput and security features, positioning itself as a developer-friendly and user-centric smart contract platform within the Web3 landscape.
Click to view current NIBI market price
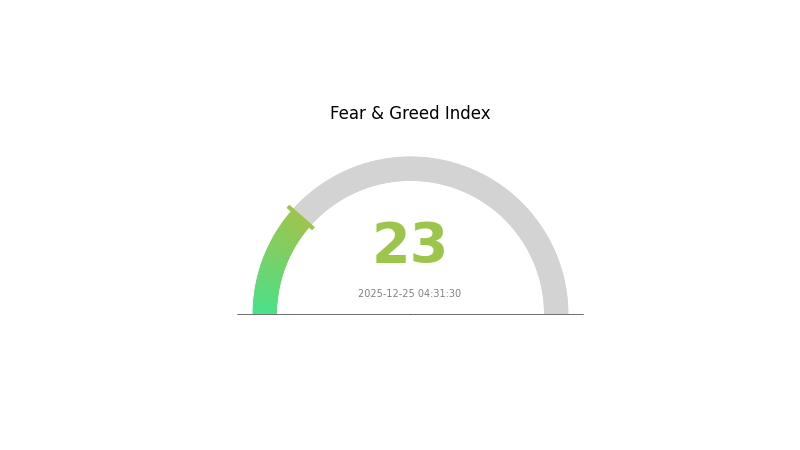
NIBI Market Sentiment Indicator
2025-12-25 Fear & Greed Index: 23 (Extreme Fear)
Click to view the current Fear & Greed Index
The crypto market is currently experiencing extreme fear, with the Fear & Greed Index dropping to 23. This indicates widespread pessimism and risk aversion among investors. Market participants are showing significant caution, with selling pressure dominating trading activity. Such extreme fear conditions often present contrarian opportunities for long-term investors, as excessive pessimism can precede market reversals. However, traders should remain vigilant and monitor key support levels. Diversification and risk management are essential during volatile periods like this. Stay informed with real-time market data on Gate.com to make strategic decisions.
NIBI Holdings Distribution
The address holdings distribution chart is a critical on-chain metric that visualizes how NIBI tokens are allocated across different wallet addresses. This distribution pattern serves as a primary indicator of the token's decentralization level, market concentration risk, and potential vulnerability to price manipulation. By analyzing the proportion of tokens held by top addresses, investors and analysts can assess the token's structural stability and the degree of wealth concentration within the network.
However, the provided data table appears to be empty, containing no specific address holdings information. Without concrete distribution data showing the quantity and percentage of NIBI held by individual addresses, a comprehensive assessment of the current concentration characteristics and potential centralization risks cannot be conducted. To properly evaluate whether NIBI exhibits excessive concentration—a condition where a small number of addresses control a disproportionately large share of the token supply—we would require detailed breakdowns of top holder positions and their respective ownership percentages.
A meaningful analysis of NIBI's address distribution would typically examine whether the top 10, top 100, or top 1,000 addresses collectively control a concerning proportion of total supply, as this directly impacts market resilience and price stability. The absence of this data prevents determination of whether the token maintains a healthy decentralized structure or faces significant concentration risks that could amplify volatility and increase manipulation potential.
Click to view current NIBI holdings distribution

| Top |
Address |
Holding Qty |
Holding (%) |
II. Core Factors Influencing NIBI's Future Price
Supply Mechanism
-
Token Distribution and Ecosystem Growth: NIBI serves as the staking and utility token for the Nibiru Chain mainnet. Historical supply changes have significantly impacted price movements. Following the mainnet launch on March 12, 2024, NIBI token price surged 2200%, reaching peak levels, demonstrating how supply-related events and ecosystem expansion directly influence price performance.
-
Current Impact: Nibiru Chain's expansion strategy focuses on ecosystem development, including Genesis NFT series launches and Asia-Pacific regional expansion targeting South Korea, China, India, Japan, Vietnam, and Thailand. These growth initiatives are expected to increase demand for NIBI tokens.
Technology Development and Ecosystem Construction
-
Ethereum Virtual Machine Compatibility: Nibiru Chain is upgrading to achieve full Ethereum Virtual Machine (EVM) compatibility, ensuring further interoperability with Ethereum-based decentralized applications. This integration will lower entry barriers for Ethereum developers and promote a smooth transition to Nibiru Chain's more efficient and cost-effective Layer-1 solution.
-
Hybrid Consensus Mechanism: Nibiru Chain employs a hybrid consensus mechanism combining Proof of Stake (PoS) and Proof of Work (PoW). This combination enhances security and performance, implementing finality, scalability, and security features in its architecture.
-
Ecosystem Applications: Nibiru Chain features a comprehensive dApp development ecosystem optimized for developers through built-in development kits, user-friendly APIs, language SDKs, and native oracle functionality. The platform demonstrates capabilities in handling real-world assets (RWA), DeFi, and gaming applications. The network integrates various functions including oracles and stablecoins to ensure seamless DeFi experiences.
III. 2025-2030 NIBI Price Forecast
2025 Outlook
- Conservative Forecast: $0.0066 - $0.01344
- Base Case Forecast: $0.01222
- Bullish Forecast: $0.01344 (requires sustained market sentiment and positive ecosystem developments)
2026-2028 Medium-term Outlook
- Market Phase Expectation: Consolidation with gradual recovery trend, characterized by moderate volatility and incremental adoption milestones
- Price Range Forecast:
- 2026: $0.00667 - $0.01449 (4% upside potential)
- 2027: $0.00888 - $0.01817 (11% cumulative gains)
- 2028: $0.01146 - $0.01798 (30% cumulative appreciation)
- Key Catalysts: Ecosystem expansion, strategic partnerships, increased institutional participation, and protocol upgrades driving utility adoption
2029-2030 Long-term Outlook
- Base Case Scenario: $0.01457 - $0.02339 (38% gains by 2029; assumes continued market maturation and stable macro environment)
- Bullish Scenario: $0.01533 - $0.02178 (65% gains by 2030; assumes accelerated adoption, successful platform scaling, and favorable regulatory clarity)
- Transformative Scenario: $0.02339+ (requires breakthrough technological innovations, mainstream institutional adoption, and significant expansion of use cases)
- 2030-12-31: NIBI at $0.02017 average price level (stable mid-range positioning reflecting balanced growth trajectory)
| 年份 |
预测最高价 |
预测平均价格 |
预测最低价 |
涨跌幅 |
| 2025 |
0.01344 |
0.01222 |
0.0066 |
0 |
| 2026 |
0.01449 |
0.01283 |
0.00667 |
4 |
| 2027 |
0.01817 |
0.01366 |
0.00888 |
11 |
| 2028 |
0.01798 |
0.01591 |
0.01146 |
30 |
| 2029 |
0.02339 |
0.01695 |
0.01457 |
38 |
| 2030 |
0.02178 |
0.02017 |
0.01533 |
65 |
Nibiru Chain (NIBI) Investment Analysis Report
IV. NIBI Professional Investment Strategy and Risk Management
NIBI Investment Methodology
(1) Long-term Holding Strategy
-
Suitable Investors: Long-term believers in Layer 1 blockchain infrastructure, developers interested in smart contract platforms, and investors with high risk tolerance seeking exposure to emerging L1 ecosystems.
-
Operational Recommendations:
- Dollar-cost averaging (DCA) approach: Regular purchases at fixed intervals to reduce timing risk and average entry costs over time.
- Accumulation during market downturns: The current price of $0.012107 represents a significant discount from the all-time high of $1.032, potentially offering attractive entry opportunities for long-term investors.
- Maintain minimum 12-24 month holding period to capture potential ecosystem development and adoption cycles.
(2) Active Trading Strategy
NIBI Risk Management Framework
(1) Asset Allocation Principles
-
Conservative Investors: 0.5-1% portfolio allocation - Limit exposure to small positions, prioritizing capital preservation over growth.
-
Moderate Investors: 1-3% portfolio allocation - Balance growth potential with acceptable risk levels, suitable for investors with medium risk tolerance.
-
Aggressive Investors: 3-5% portfolio allocation - Increase exposure to emerging L1 projects, accepting higher volatility for potential upside participation.
(2) Risk Hedging Strategies
-
Portfolio Diversification: Combine NIBI holdings with established blockchain assets and traditional investments to reduce concentration risk and overall portfolio volatility.
-
Position Sizing: Scale positions gradually rather than deploying full capital at once, allowing for better risk-adjusted entry points and manageable drawdowns.
(3) Secure Storage Solutions
V. NIBI Potential Risks and Challenges
NIBI Market Risks
-
Extreme Volatility: NIBI has experienced significant price fluctuations, with a year-to-date decline of 78.63% from its peak, reflecting substantial downside risk and high price volatility typical of early-stage projects.
-
Low Market Capitalization: With a fully diluted valuation of approximately $18.16 million and market dominance of only 0.00057%, NIBI remains a micro-cap asset vulnerable to significant price swings from relatively small trading volume changes.
-
Liquidity Constraints: The 24-hour trading volume of $1.2 million relative to market cap indicates potential liquidity limitations that could impact entry and exit execution, particularly for larger positions.
NIBI Regulatory Risks
-
Evolving Regulatory Environment: The cryptocurrency industry faces increasing regulatory scrutiny globally, which could impact Nibiru Chain's ability to operate or expand into regulated markets.
-
Compliance Requirements: Future regulatory developments may impose operational constraints, listing restrictions, or geographical limitations that could affect token utility and adoption.
-
Institutional Adoption Barriers: Regulatory uncertainty may limit institutional participation and mainstream adoption, constraining long-term growth potential.
NIBI Technology Risks
-
Network Security Risks: As an L1 blockchain, Nibiru Chain faces ongoing security challenges including potential smart contract vulnerabilities, consensus mechanism attacks, or unforeseen protocol issues.
-
Development Execution Risk: The success of the platform depends heavily on the development team's ability to deliver planned features, maintain network stability, and successfully scale infrastructure.
-
Competition from Established Chains: Nibiru Chain faces significant competition from established L1 platforms and emerging alternatives, creating risk of market share erosion and reduced developer adoption.
VI. Conclusion and Action Recommendations
NIBI Investment Value Assessment
Nibiru Chain presents a high-risk, early-stage investment opportunity within the Layer 1 blockchain ecosystem. The project's ambitious positioning as a developer-friendly smart contract platform offers potential upside if the team successfully executes on its roadmap and achieves meaningful ecosystem adoption. However, the significant price decline of 78.63% over the past year, combined with low market capitalization and trading volume, reflects substantial execution and market risks. The current valuation may offer attractive risk-reward dynamics for contrarian investors with high risk tolerance, but capital preservation should remain a priority given early-stage project dynamics.
NIBI Investment Recommendations
✅ Beginners: Start with minimal position sizing (0.5-1% of crypto portfolio) through dollar-cost averaging via Gate.com, focusing on understanding the project fundamentals before increasing exposure. Avoid attempting to time the market based on short-term price movements.
✅ Experienced Investors: Develop a structured investment thesis based on technological differentiation, ecosystem development progress, and comparative advantages versus competing L1 platforms. Monitor quarterly developments and consider scaling positions as de-risking catalysts materialize.
✅ Institutional Investors: Conduct thorough due diligence on team credentials, technical architecture, and strategic partnerships. Consider positions only after comprehensive risk assessment and clear identification of strategic rationale for exposure to emerging L1 infrastructure.
NIBI Trading Participation Methods
-
Spot Trading on Gate.com: Purchase NIBI tokens directly through Gate.com's spot trading platform using major trading pairs (USD, USDT, etc.), allowing full custody and long-term holding capabilities.
-
Active Trading Strategies: Utilize Gate.com's trading tools for wave trading, swing trading, or momentum-based strategies, monitoring price action around identified support and resistance levels.
-
Staking and Ecosystem Participation: Once sufficient holdings are accumulated, explore opportunities to participate in network staking or ecosystem incentive programs to generate additional yield beyond passive price appreciation.
Cryptocurrency investments carry extreme risk of capital loss. This report does not constitute investment advice. Investors must make decisions based on personal risk tolerance and financial situation. Consult qualified financial advisors before committing capital. Never invest more than you can afford to lose completely.
FAQ
What is Nibi crypto?
NIBI is the native token of the Nibiru blockchain, used for proof-of-stake consensus, decentralized governance, and paying transaction fees. Token holders can stake their NIBI to secure the network and earn staking rewards.
How much is 1 Nibiru to a dollar?
As of December 25, 2025, 1 Nibiru (NIBI) is worth approximately $0.0142 USD. The exchange rate has been increasing, making NIBI a growing asset in the crypto market.
What is the price prediction for NIBI in 2025?
NIBI is predicted to reach approximately $0.01276 by end of 2025. The price is expected to fluctuate throughout the year but maintain stability around this level. Long-term forecasts suggest potential adjustment to $0.009987 by early 2026.
What factors could influence Nibiru (NIBI) price in the future?
Key factors include institutional adoption rates, market sentiment, macroeconomic trends, blockchain development progress, trading volume, regulatory changes, and overall cryptocurrency market conditions.
What is the all-time high and low price of NIBI?
NIBI reached an all-time high of $0.9601 and an all-time low of $0.008349.
How does NIBI compare to other layer-1 blockchain projects?
NIBI is the native token of Nibiru Chain, a Layer 1 blockchain emphasizing scalability and interoperability. It distinguishes itself by bridging Web2 and Web3, offering competitive advantages over projects like Ethereum and Solana through innovative developer-focused features.
* The information is not intended to be and does not constitute financial advice or any other recommendation of any sort offered or endorsed by Gate.